
Fig. 3.
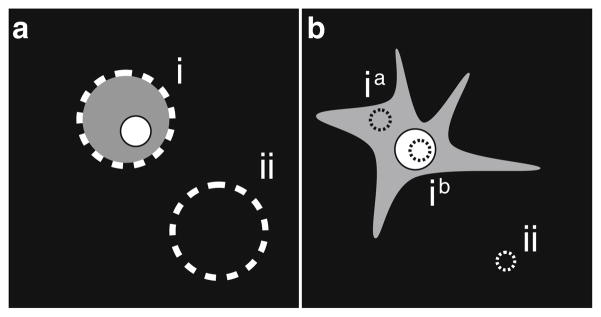
Assaying UPS-GFP reporter levels by quantitative microscopy. (a) Equatorial image of a trypsinized, spherical cell transfected with a protein of interest. To determine the fluorescence intensity of the UPS reporter, subtract the total integrated pixel intensity of region (ii) from the total integrated pixel intensity of region (i). (b) Adherent cell transfected with protein of interest. To determine the mean fluorescence of the UPS reporter in the cellular compartment of interest (e.g., cytosol ia or nucleus ib), subtract the mean intensity of the background region (ii) from the mean intensity of the compartment investigated.