Figure 1.
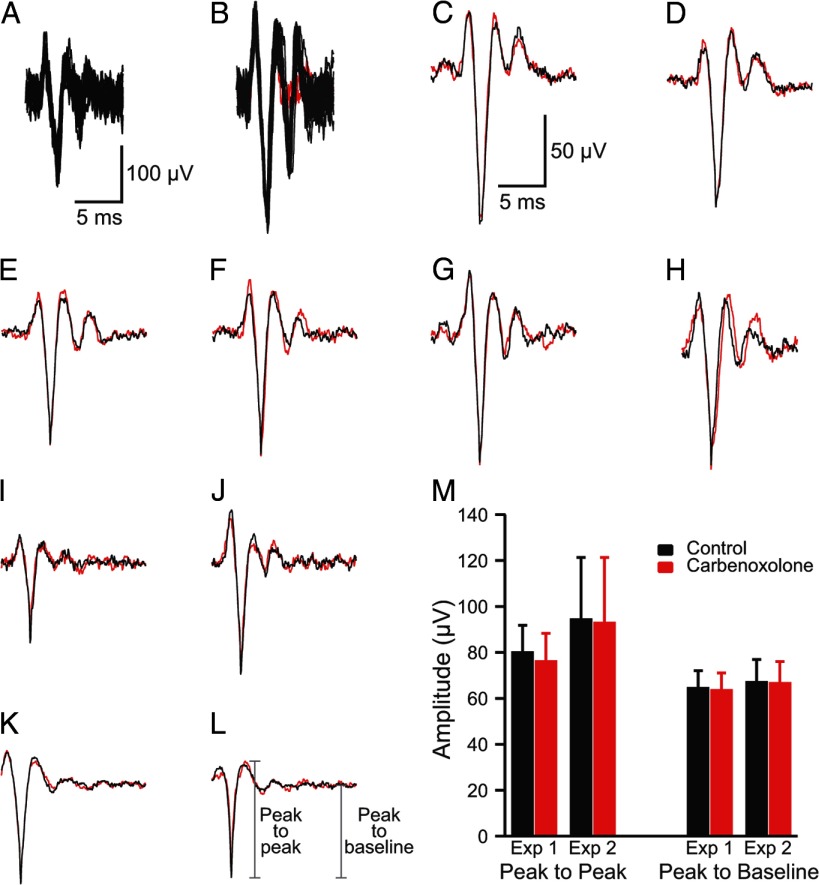
Characteristics of CS recordings. A, B, Extracellularly recorded CS activity. Each panel shows 20 overlapped traces. In B, the last spikelet of the CS failed to occur in two cases (red traces). Calibration bars in A are for A and B. C–H, Average CS waveform recorded by one electrode at the beginning (black) and the end (red) of the recording session. Approximately 50 traces are in each average. I–L, Average CS waveform in control condition (black) and after desynchronization of CS activity by carbenoxolone injection into the IO (red). Averages are from ∼50 (I, J) and ∼200 (K, L) records. Calibration bars in C are for C–L. M, Average amplitude of CS waveform in control (black bars) and after desynchronization with carbenoxolone (red bars). Averages are of 11 PCs (Exp 1) and 16 PCs (Exp 2). Error bars are 1 SD.

