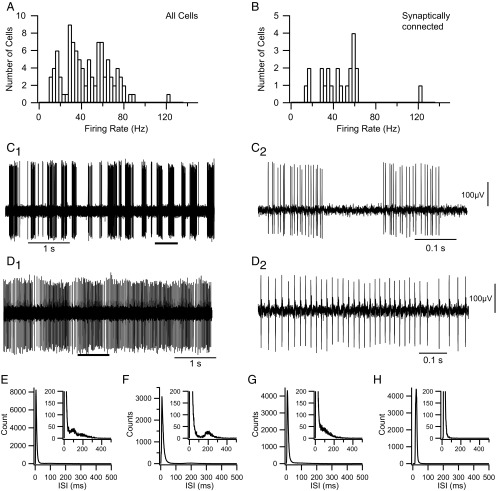
Figure 2.
Firing patterns of CN neurons. A, B, Histograms of CN firing rates for the entire recorded population (A) and for those CN neurons identified as synaptically connected to recorded crus 2a PCs (B). Firing rates typically represent the rate averaged over a 20–40 min recording session. C, D, Extracellular recordings from CN neurons showing typical burst (C) and tonic (D) firing patterns. The segments indicated by the thick horizontal bars in C1 and D1 are shown at an expanded time scale in C2 and D2. Voltage calibration in C2 is also for C1, and that in D2 is also for D1. E–H, Interspike interval (ISI) histograms from four cells showing the range of patterns observed. E–G, Examples of ISI histograms from burst firing CN neurons. All show long rightward tails to their distributions. Some show a secondary peak (E, F) indicative of a preferred pause duration, but others do not (G). The ISI in E is from the cell shown in C. H, ISI histogram from the tonically firing cell shown in D.

