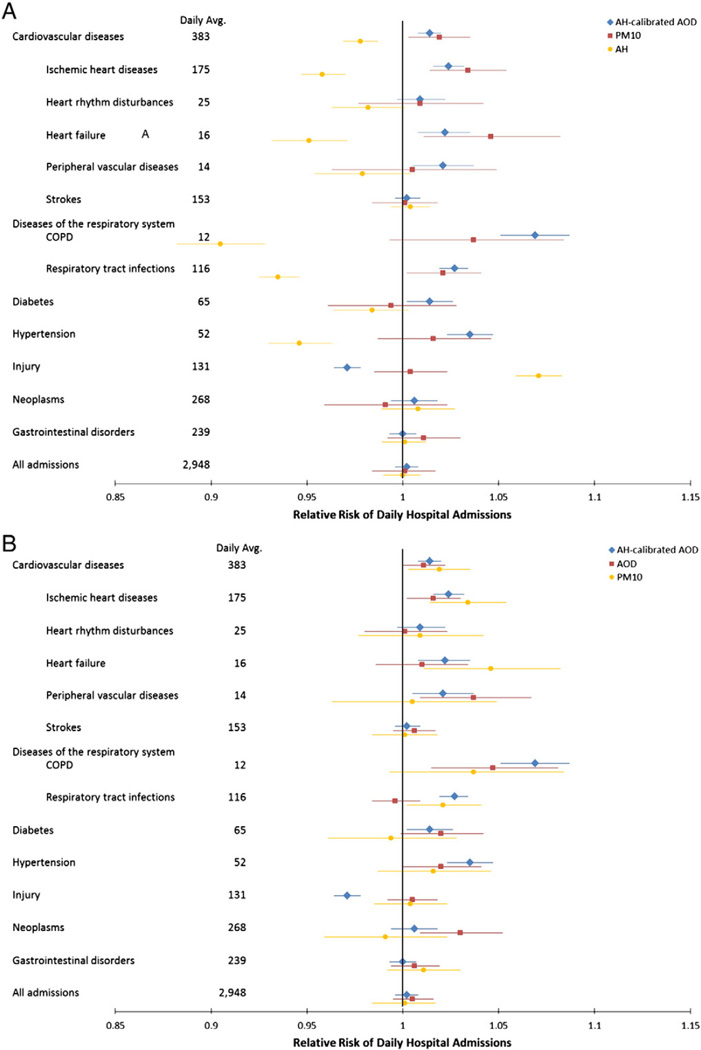
Fig. 4.
Effects of ground and satellite remote monitored air pollution and absolute humidity on daily hospital admissions. In the analyses of AH-calibrated AOD and AH, day of week was included as covariate; and in the analyses of AOD and PM10, absolute humidity and day of week was used as covariates. Since there were significant drops of admission before 2007 New Year, we excluded the last week of 2006. The final hospital admission data included 257 days for AH-calibrated AOD and AOD model analyses, and 348 days for PM10 and AH analyses. In all analyses, AH-calibrated AOD, AOD, PM10, and AH were log2-transformed for easy comparison.

