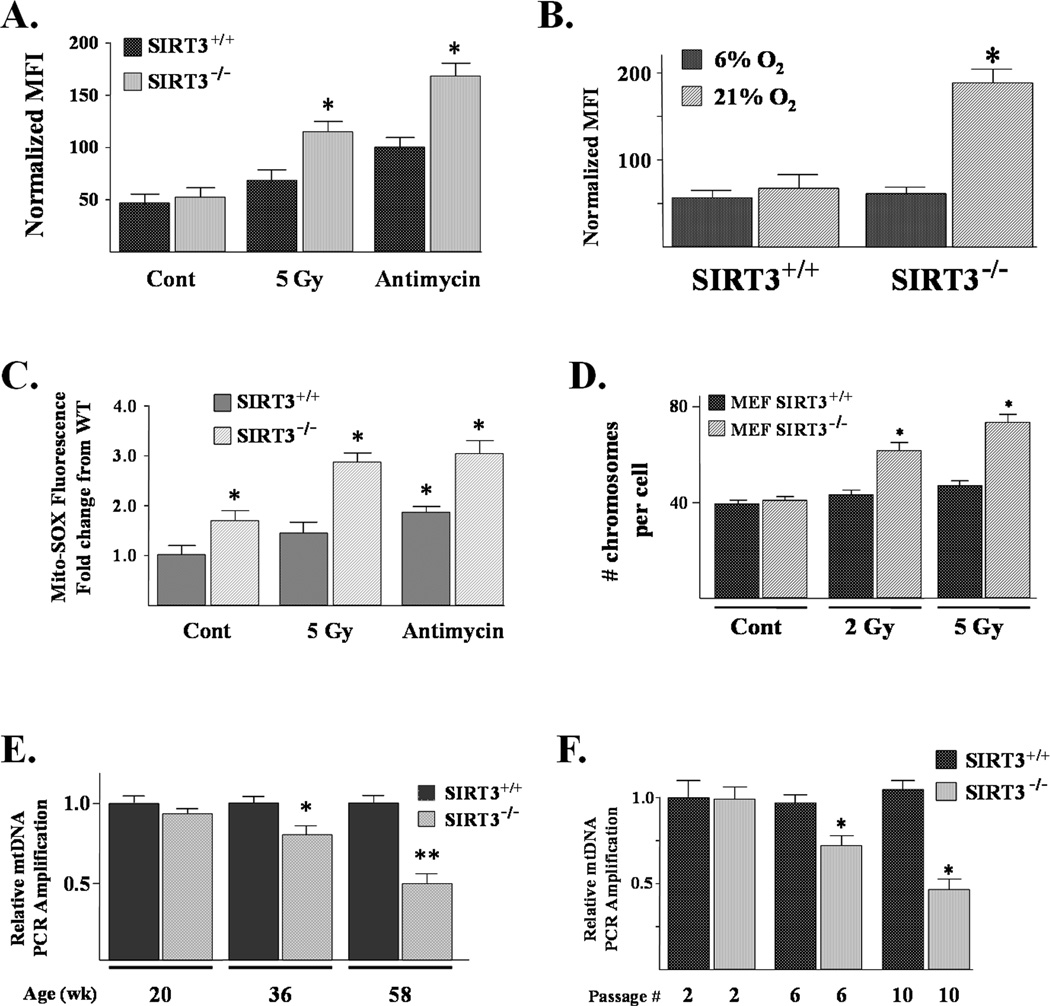
Figure 1. SIRT3 knockout MEFs exhibit increased superoxide levels, aneuploidy in response to exogenous stress, and decreased mitochondrial integrity with increasing age.
(A) Superoxide levels were elevated in SIRT3 knockout cells exposed to agents that induce mitochondrial damage. SIRT3+/+ and SIRT3−/− MEFs were cultured in 6% oxygen and exposed to either 5 Gy of IR or 5 µM of antimycin A for 3 hours, and superoxide levels were monitored by DHE oxidation as compared to control, untreated cells (Cont). For all DHE oxidation experiments the results were the normalized MFI for three independent replicates. (B) SIRT3−/− superoxide levels were elevated when cultured in 21% oxygen. SIRT3+/+ and SIRT3−/− MEF cells were cultured at 21% O2 for 6 hrs and superoxide levels were monitored by DHE oxidation, as compared to control cells grown at 6% O2. (C) Mitochondrial superoxide levels are elevated in SIRT3 knockout MEFs and increase following exogenous stress. Mitochondrial superoxide levels were determined by the addition of Mito-SOX (3 µM) to the culture medium and cells were incubated for an additional 10 minutes before being trypsinized and resuspended. Fluorescence was measured via flow cytometry, and 20,000 and 40,000 cells were counted for each sample. (D) SIRT3 knockout MEFs exhibited aneuploidy following exposure to IR. SIRT3+/+ and SIRT3−/− MEFs were exposed to either 2 or 5 Gy. Whole-mount chromosomes were counted in a blinded fashion. Bars show the mean chromosome number per cell from 100 separate counts. (E) Livers from SIRT3 knockout mice have increased mtDNA damage with age. DNA was isolated from the livers of SIRT3 wild-type and knockout mice at 20, 36, and 58 weeks, and mtDNA primers that amplify either the 10 kb Amplicon or a 117 bp region (Supplemental Fig. S4A) were used for PCR. Primers to the genomic p-globin gene were used as a control. (F) SIRT3 knockout MEFs have decreased mtDNA integrity. DNA was isolated from SIRT3+/+ and SIRT3−/− MEFs at passage 2, 6, and 10, and mtDNA primers that amplify either the 10 kb Amplicon used for PCR. All the results in this figure are from at least three separate experiments. Data are presented as the average +/− SD. * indicates P < 0.05 by t-test. See also Figure S1.

