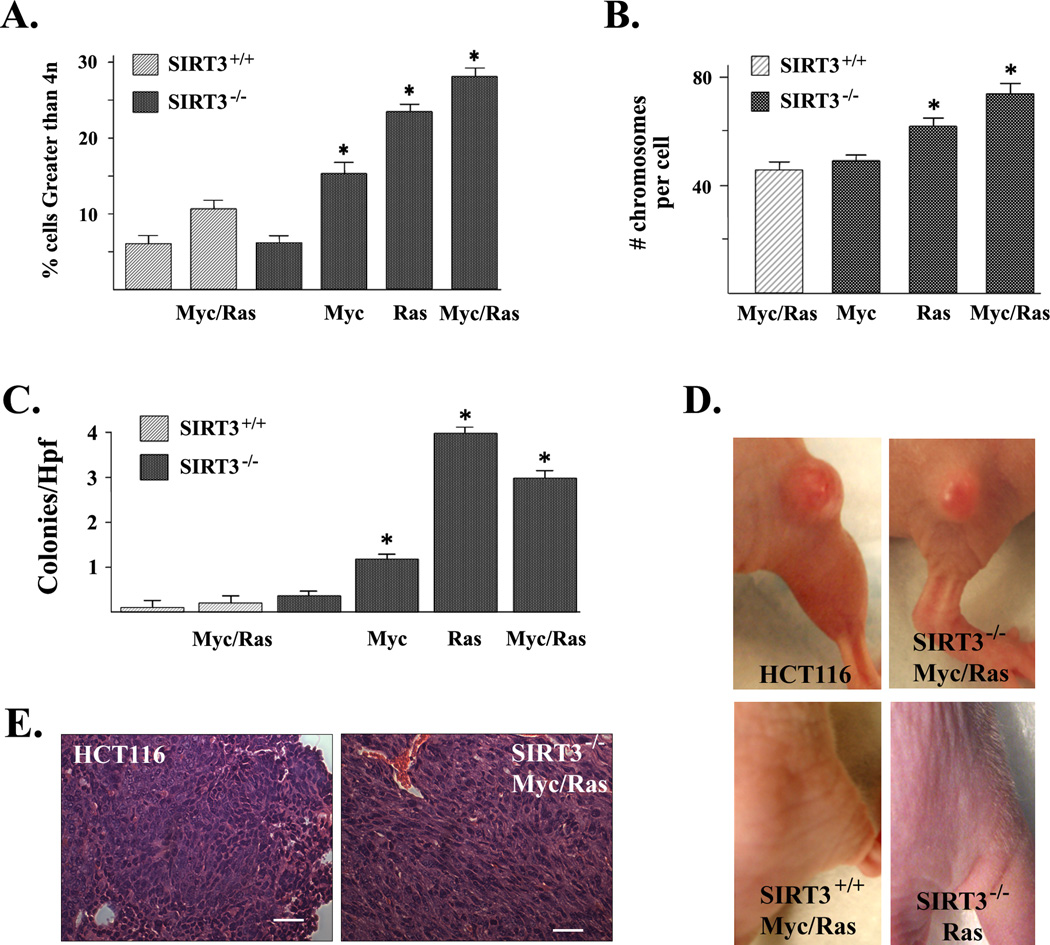
Figure 3. Loss of SIRT3 results in an invasive and tumorigenic phenotype.
(A) SIRT3 knockout MEFs expressing Myc and/or Ras exhibit polyploidy. Transformed MEF cells were harvested and analyzed by FACS. The percentage of cells containing greater than 4n is shown. (B) SIRT3−/− Myc and/or Ras MEFs exhibit increased chromosomal aberrations. Whole-mount chromosomes were counted in a blinded fashion. Columns are the mean chromosome number per cell from 100 separate counts. (C) SIRT3 knockout MEFs expressing Ras or Myc or both display anchorage independent growth in soft agar. SIRT3+/+, SIRT3−/−, SIRT3+/+ Myc/Ras, SIRT3−/− Myc, SIRT3−/− Ras, and SIRT3−/− Myc/Ras cells were seeded and colonies were stained with methylene blue after 12 days and counted. (D) SIRT3+/+, SIRT3−/−, SIRT3+/+ Myc/Ras, SIRT3−/− Myc, SIRT3−/− Myc/Ras, and SIRT3−/− Ras cells were implanted into both hind limbs of nude mice. Photographs of the hind limbs of nude mice injected with the cells are shown. (E) Histological examination of SIRT3−/− Myc/Ras allograft tumors stained with H&E. Results in this figure are the mean of at least three separate experiments. Error bars represent one standard deviation about the arithmetic mean. * indicates P < 0.05 by t-test. Scale bar = 80 µm in (E).

