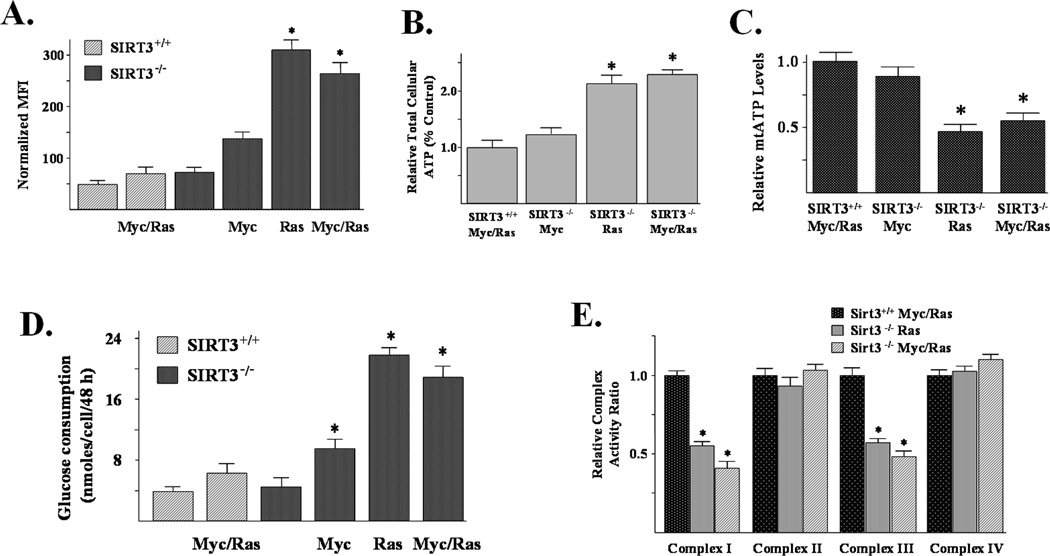
Figure 4. SIRT3 knockout MEFs expressing Myc and/or Ras have altered biochemical and metabolic properties and exhibit decreased complex I and III activity.
(A) Superoxide levels in SIRT3 wild-type and knockout Myc- and/or Ras- infected MEF cells, monitored by DHE oxidation. MFI of three independent replicates was plotted. (B) Total cellular ATP levels in SIRT3+/+ Myc/Ras, SIRT3−/− Myc, SIRT3−/− Ras, and SIRT3−/− Myc/Ras. Cells were lysed and ATP levels were measured using chemiluminescence. (C) Mitochondrial ATP levels are decreased in SIRT3 knockout cells expressing either Ras or Myc and Ras. SIRT3+/+ Myc/Ras, SIRT3−/− Myc, SIRT3−/− Ras, and SIRT3−/− Myc/Ras cells were treated with 20 mM 2DG for 4 hours and mtATP levels were measured using chemiluminescence. Data are presented as relative mtATP levels as a percentage relative to the SIRT3+/+ Myc/Ras (Control) cells. (D) Analysis of glucose consumption in SIRT3 wild-type and knockout cells infected with Myc and/or Ras. Cells were counted and medium samples were obtained at 48 hours and analyzed using an YSI glucometer. Glucose consumption was determined by subtracting glucose content at the 48-hour point from the time zero sample and dividing by the number of cells. (E) SIRT3−/− Ras and SIRT3−/− Myc/Ras cells exhibit decreased complex I and III activity. Oxidative phosphorylation enzyme activities were measured on total cellular protein. Complex I activity was measured as the rotenone inhibitable rate of NADH oxidation. Complex II activity was measured by the succinate induced rate of reduction of DCIP. Complex III activity was measured as the rate reduction of cytochrome c (III) when stimulated with CoQ2H2. Complex IV activity was measured as the rate of cytochrome c (II) oxidation. All enzyme complex activities are expressed relative to SIRT3+/+ Myc/Ras. Results are from three separate experiments. Data are presented as the average +/− SD. * indicates P < 0.05 by t-test. See also Figure S3.

