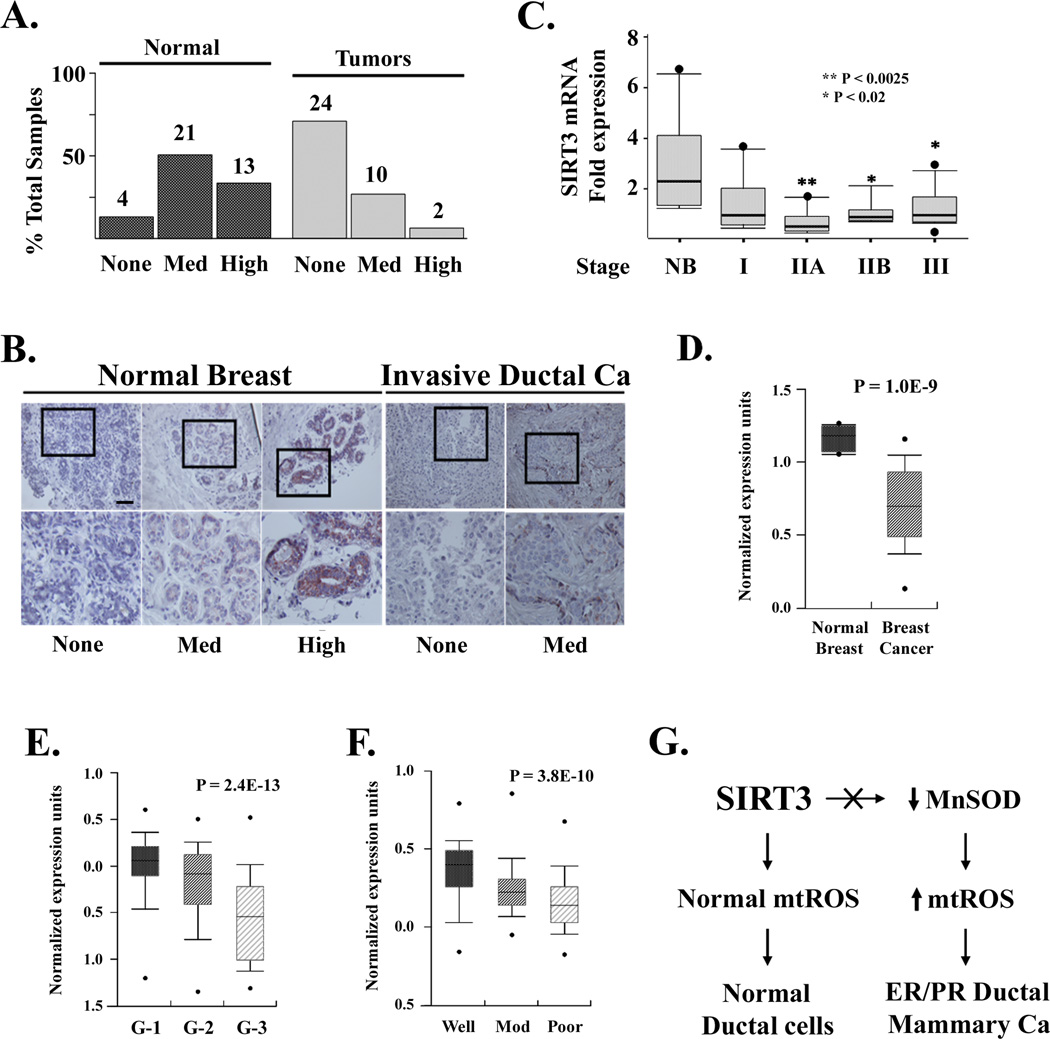
Figure 7. SIRT3 is a potential human tumor suppressor.
(A) SIRT3 protein levels are decreased in human breast tumors; 38 normal and 36 breast cancer (US Biomax, Inc) samples were measured by IHC on a tissue array. Tissue arrays were stained with a human SIRT3 antibody (Cell Signaling Technology, Inc) and slides were read by two independent researchers. Levels of SIRT3 staining were classified as absent, medium, or high. (B) IHC images from breast tumor and normal samples demonstrating SIRT3 staining. The boxed regions (enlarged in the bottom row) show SIRT3 in normal epithelium (left six images) and breast tumors (right four images). (C) SIRT3 expression in RNA samples from normal breast (NB) and Stage I, IIA, IIB, and III breast malignancies (TissueScan Breast Cancer Panel 1 Origene). SIRT3 expression was determined by qRT-PCR using SIRT3 and β-actin Taqman probes (ABI). (D-F) SIRT3 expression is decreased in human breast cancer and as a function of pathological classification. The Oncomine cancer microarray database (http://www.oncomine.org) was used to determine SIRT3 expression in (D) normal versus breast cancers (Richardson et al., 2006), as a function of (E) Elston (G-1, G-2, or G-3) Grade (Ivshina et al., 2006), or (F) pathological (well, moderately, or poorly differentiated) differentiation (Sotiriou et al., 2006). The y-axis represents normalized expression units. Shaded boxes represent the interquartile range; whiskers represent the 10th-90th percentile range; bars represent the median. (G) Schema for the development of increased mtROS and ER/PR positive mammary tumors in ductal cells lacking SIRT3. Scale bar = 80 µm in (B). See also Figure S6.

