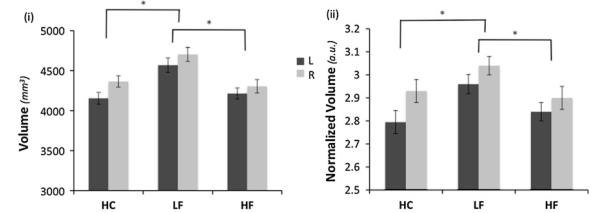
Fig. 1.

Differences in hippocampal volume. The bar plots show the hippocampus volume comparisons for low frequency (LF), high frequency (HF) and healthy controls (HC). LF migraineurs had a significantly larger hippocampal volume. (i) Raw volume comparisons—for the statistical analysis the left and right hippocampal volumes of the cohorts were compared while using the total intracranial volume and age as covariates. (ii) The same comparison for normalized volumes (normalized to the total intracranial volume) volumes. Bar heights represent the mean value for each volumetric measurement. Error bars represent the 95 % confidence interval of the mean. Asterisk denotes a significance level of the corresponding P value reported (see text)
