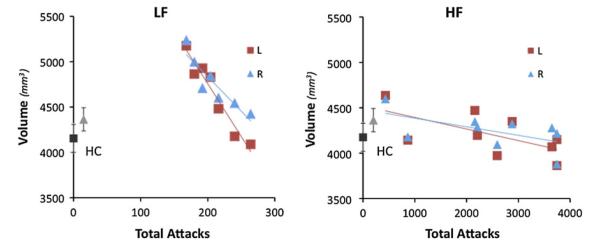
Fig. 2.

Migraine attacks and hippocampal volumetric differences. The plots represent the correlation between the left and right hippocampal volumes and estimate of the total number of migraine attacks in low frequency (LF left panel) and high frequency (HF right panel) migraine patients. Average hippocampal volume in healthy control (HC) subjects are also shown in gray scale colors in each panel for comparison
