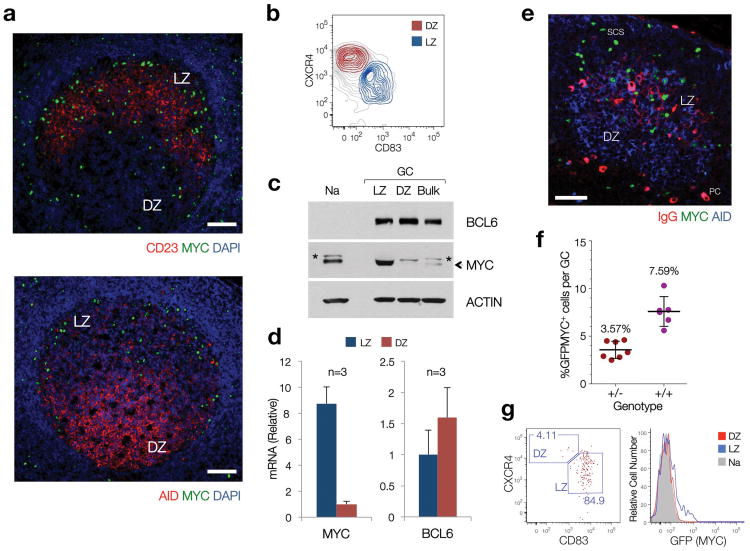
Figure 1. A subset of LZ GC B cells express MYC under physiologic conditions.
(a) Immunofluorescence staining, paraffin-embedded sections of reactive human lymph nodes. CD23, expressed in Follicular Dendritic cells50 (FDC), highlights the boundaries of the LZ. AID is used as a DZ marker, as previously reported4, 51. Scale Bars = 200μm. (b) Sorting profiles of LZ and DZ GC B cell subpopulations in human tonsils (See Supplementary Fig. 1) (c) Immunoblot of populations shown in (b). (Na), Naive B cells. (Bulk), bulk CD77+ GC B cells, isolated as in9. The asterisk denotes a non-specific band. Actin is used as loading control. (d) Quantitative RT-PCR for MYC and BCL6 mRNA levels in LZ and DZ B cell pools. Average of 3 independent cell pools per population (n=3). Error bars, standard deviation (SD). (e) Immunofluorescence staining, paraffin-embedded section, mouse lymph node (12 days after SRBC immunization). AID highlights the GC (DZ). IgG highlights the FDC network (i.e. LZ). Scale bar = 50μm. PC, plasma cell. SCS, subcapsular sinus (f) Number of MYC+ B cells, as assessed by flow cytometry (GFP=MYC) in LZ and DZ GC B cell subsets from GFPMYC mice (12 days post-immunization). (g) Distribution of GFPMYC+ GC B cells among LZ and DZ subsets. Left panel, dot plot analysis. Right panel, histogram shows the relative GFPMYC fluorescence intensities within these cell subsets. Shadowed histogram, Naive B cells (Na), used as a reference.

