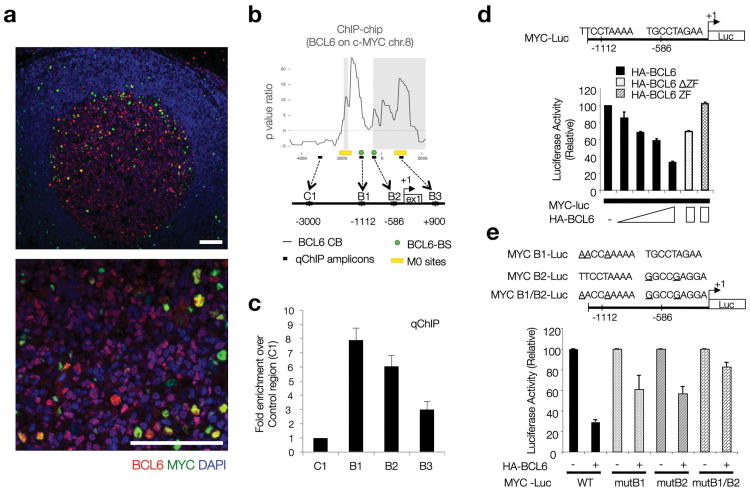
Figure 3. BCL6 represses MYC protein expression in DZ GC B cells.
(a) Immunofluorescence co-staining for MYC and BCL6 in human reactive lymph nodes. BCL6 (red) highlights the boundaries of the GC. DAPI (blue), nuclear counterstain. Scale bars= 200μm. (b) BCL6 chromatin binding profile (ChIP-chip) at the MYC locus in human CD77+ GC B cells. The diagram shows the organization of this locus in the region around Exon1 and the transcription start site (+1). B6BS and M0 potential BCL6 binding sites are based on previously defined consensus14. The qChIP amplicons referred to in panel (c) are shown here as black boxes (B1-3, C1). Raw data corresponding to the ChIP-chip analysis at the MYC locus is provided in Supplementary Table 1, available online. (c) Quantitative PCR on DNA isolated from an independent BCL6 chromatin immunoprecipitation assay in CD77+ GC B cells. Fold enrichment refers to the ‘normalized’ binding at each region, relative to C1 (arbitrarily set to 1). ‘Normalized binding’ measures the relative enrichment in BCL6 immunoprecipitates over background (i.e. species or isotype matched irrelevant antibody). Average of 3 technical replicates (Error bar=SD). (d) Dual-Luciferase reporter assay, HEK293T cells. Effects of WT BCL6 or two defective truncations (as indicated) on the 1.2 Kb upstream MYC regulatory region depicted in the diagram, which includes two BCL6 potential binding sites. Average of 2 technical replicates from a representative experiment (Error bar=SD). (e) Same assay as in panel (d), but using Luciferase reporter constructs where point mutations on each putative BCL6 consensus site were introduced, as indicated. Average of 2 technical replicates from a representative experiment (Error bar=SD).

