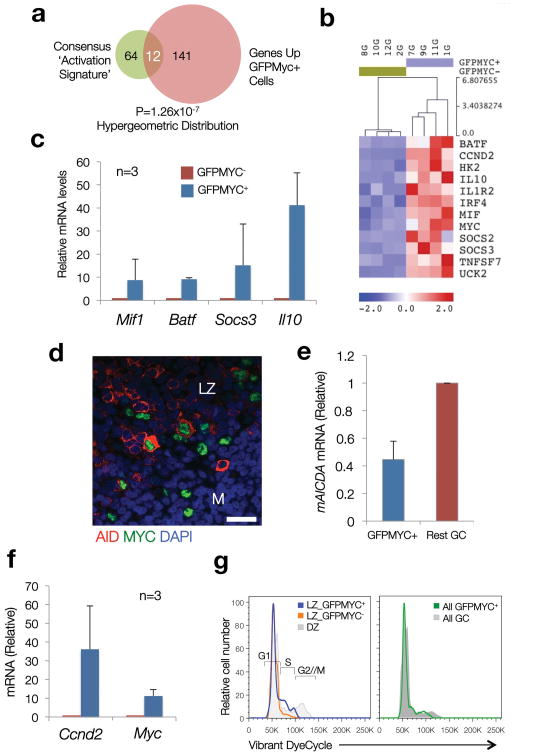
Figure 4. Coordinated upregulation of immune activation signatures and cell cycle entry genes in GFPMYC+ GC B cells.
(a) A consensus ‘Activation Signature’, integrated by genes common to two or more published ‘immune activation’ signatures, was built (76 genes, details in Supplementary Table 4). The overlap between this signature and that of GFPMYC+ GC B cells (Venn diagram) was determined using a hypergeometric distribution (=12 genes). (Normalized Enrichment Score (NES)=2.34 (P val<0.00001; FDR=0%) using the GSEA algorithm). (b) Expression profile of the 12 consensus ‘immune activation’ genes enriched in GFPMYC+ cells. (c) Relative mRNA levels of selected ‘immune activation’ genes in GFPMYC+ cells, average of 3 independent cell pools (2 mice per pool). Error bars=SD. (d) Co-expression of AID (red) and MYC (green) in murine GC B cells (immunofluorescence, murine lymph node; DAPI (blue), nuclear counterstain). Scale bar, 20 μm. (e) Relative Aicda (AID) mRNA levels in GC B cell subsets isolated from GFPMYC mice, 12 days after SRBC immunization. Average of 2 independent experiments. Error bars, SD. (f) Relative Ccnd2 mRNA levels in GFPMYC+ and GFPMYC- populations (qRT-PCR). Average of 3 independent cell pools (2 mice per pool). (g) Cell cycle profile analysis in LZ and DZ GC B cells. Surface CXCR4-CD86 define the LZ and DZ subpopulations6. These histograms correspond to one mouse, representative of 3. Cell cycle phases are defined based on DNA content, adjusted to a Watson-Pragmatic model. Right panel, cell cycle distribution in bulk GFPMYC+ GC B cells, as compared to whole GC B cells.

