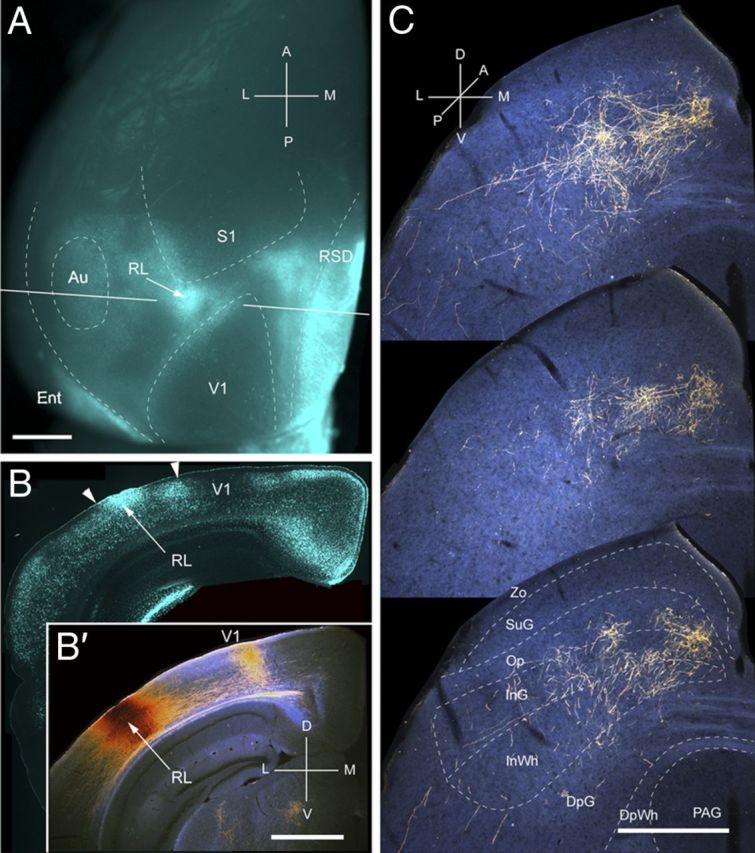
Figure 9.

Projections of RL to the SC. A, In situ image of callosal connections retrogradely labeled with the fluorescent tracer bisbenzimide (blue). BDA injection site (arrow) in the small callosal ring on the lateral side of V1. White lines indicate the rostrocaudal level of the coronal sections shown in B and B′. B, Coronal section showing bisbenzimide-labeled callosal connections and injection site (arrow). Right arrowhead marks V1/RL border. Left arrowhead indicates RL/AL border. B′, Dark-field image of section adjacent to B, showing that BDA injection is confined to gray matter. C, Dark-field images of BDA-labeled axonal branches terminating in deep layers of the SC. Scale bars: A, B, B′, 1 mm; C, 0.5 mm. For abbreviations, see Figure 1.
