
Figure 8.
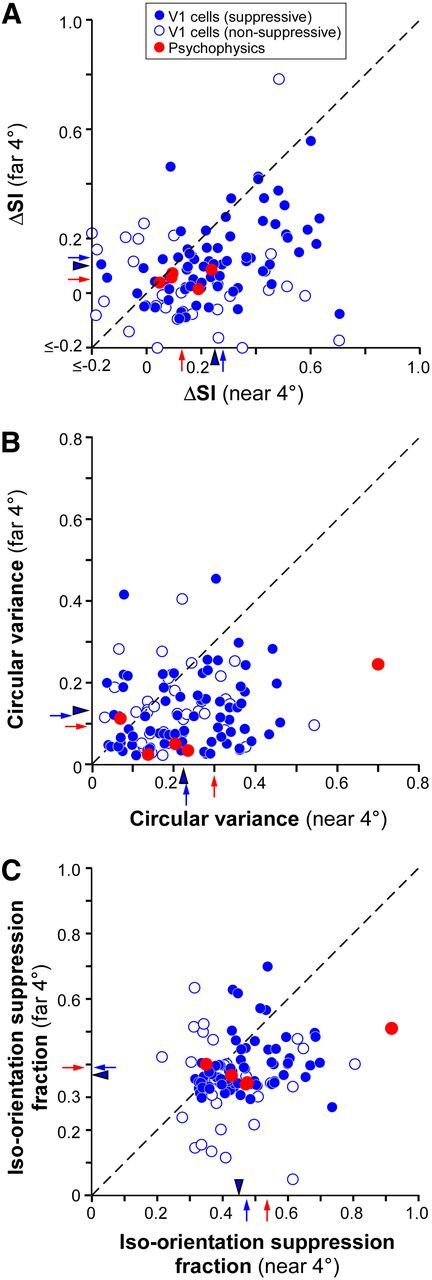
Comparison of orientation selectivity of suppression and iso-orientation suppression fraction in V1 cells and human psychophysics. A, Scatterplot of the ΔSI of suppression in the near versus far surround. B, Scatterplot of the CV of suppression in the near versus far surround. C, Scatterplot of iso-orientation suppression fraction in the near versus far surround. Only near4° and far4° conditions are shown. Empty blue dots, V1 cells that showed no suppression in the near and far surround; solid blue dots, V1 cells that showed at least one form of suppression (near or far); red dots, psychophysics data; red arrows, means of psychophysics data; solid blue arrows, means of suppressive cells; arrowheads, means of all V1 cells (suppressive and nonsuppressive).