
Figure 9.
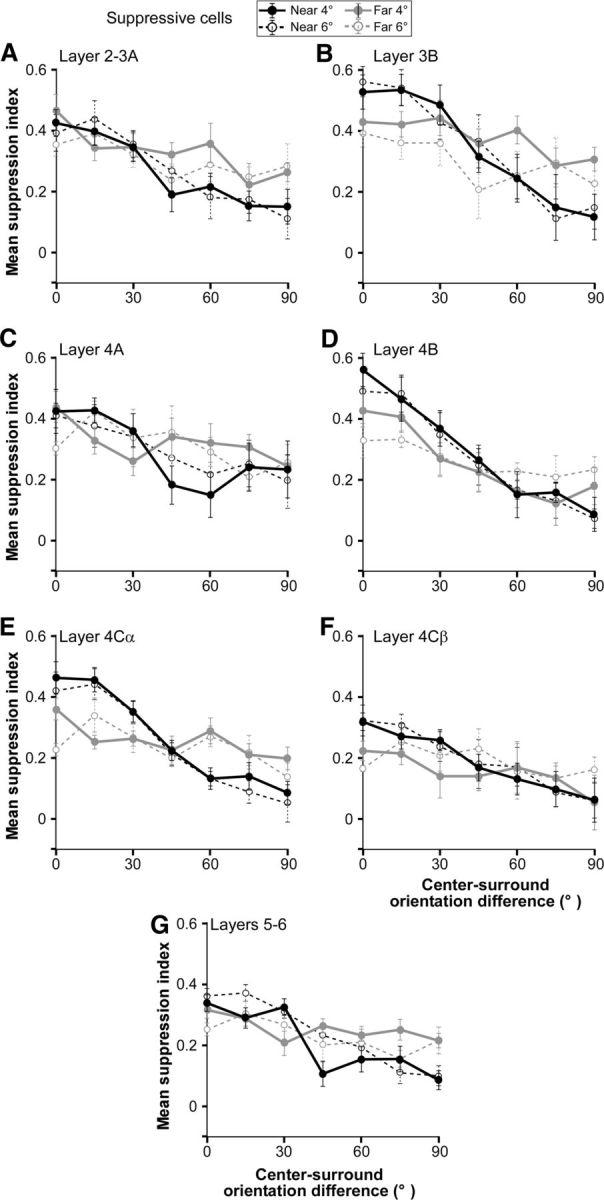
Orientation tuning of near- and far-surround suppression in different V1 layers. A–G, Average orientation tuning curves of near-surround (black curves) and far-surround (gray curves) suppression for population of V1 neurons recorded in specific V1 layers (as indicated). Only cells that showed suppression in a given stimulus condition were included in the tuning curve for that condition. Conventions are as in Figure 5. Mean ΔSI and CV values for each layer are reported in Table 1.