
Figure 2.
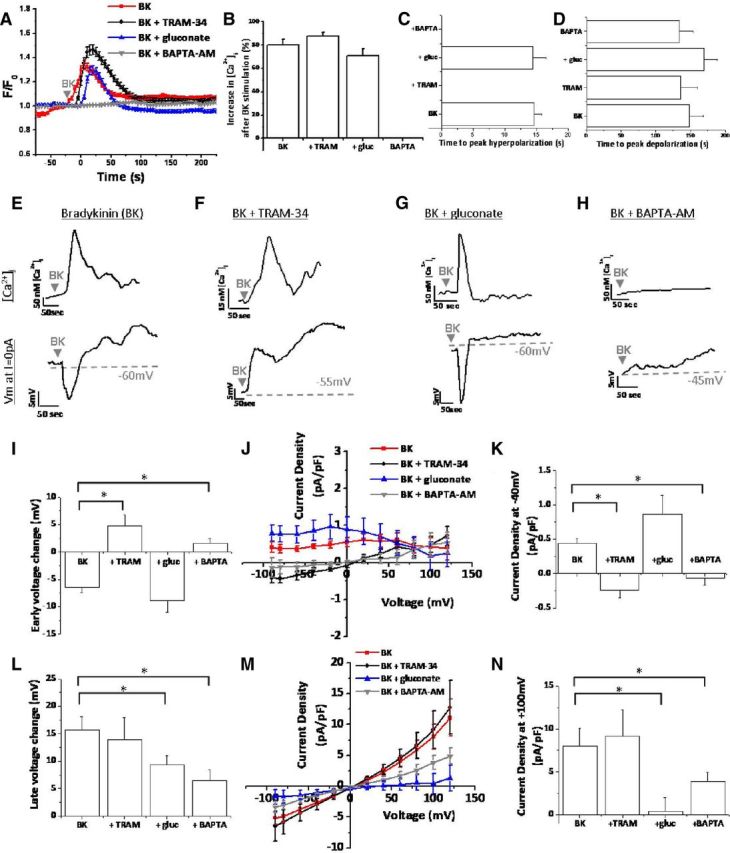
Bradykinin-induced [Ca2+]i elevations activate KCa3.1 channels and Cl− channels in human glioma cells. A, Fura-2 340/380 ratios after application of 10 μm bradykinin (BK). F/F0 indicates fluorescence normalized to fluorescence at t = 0 s. B, Percentage of cells responding to BK with a rise in [Ca2+]i. C, D, Time to BK-induced peak hyperpolarization and depolarization, respectively. E–H, Representative cells for BK, BK plus TRAM-34, BK plus gluconate (gluc), and BK plus BAPTA-AM conditions. Top traces depict [Ca2+]i versus time. For the same cell at the same time points, bottom traces depict membrane potential (Vm) at I = 0 pA versus time. I, Peak early-phase voltage change (millivolts). J, K, BK-induced current–voltage changes during early-phase response. L, Peak late-phase voltage change (millivolts). M, N, BK-induced current–voltage changes during late-phase response. n = 10–21 cells; *p < 0.05.