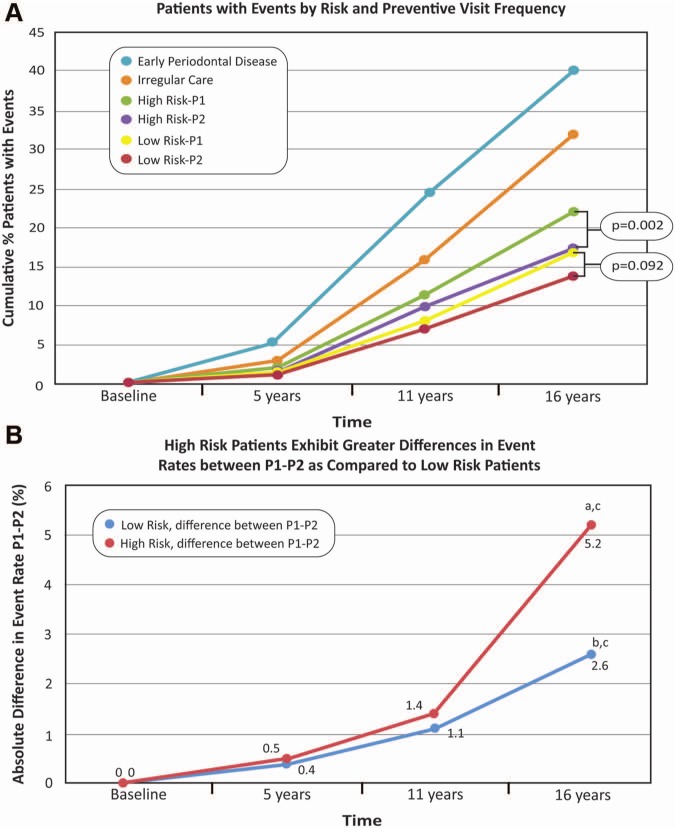
Figure 2.
The influence of risk status and frequency of preventive visits on tooth loss events. Panel A demonstrates a 13.8% cumulative event rate for low-risk patients with 2 preventive visits annually (LoR-P2), in contrast to 22.1% in high-risk patients with 1 visit annually (HiR-P1). In low-risk (LoR) patients, 2 preventive visits per yr (LoR-P2) were no better than 1 preventive visit per yr (LoRP1) in reducing the percentage of patients with tooth loss events over 16 yrs. In high-risk patients, 2 preventive visits per yr (HiR-P2) significantly reduced the number of patients who had events, in contrast to 1 visit per yr (HiR-P1; p = .002). The ‘irregular care’ patients are individuals with limited numbers of visits during the indexing period (Table), while the patients considered to have periodontitis during the indexing period were identified according to high-frequency visits of > 14 during the six-year time frame. Panel B shows that the slope of the absolute difference between 1 and 2 preventive visits annually for HiR patients over time differed from 0a (HiR P1-P2 diff; p = .005). At 16 yrs, an additional 2.6/100 LoR patients experienced events as a result of 1 preventive visit per yr in contrast to 2, and the slope of the absolute difference between 1 and 2 preventive visits annually for low-risk patients over time was not different from 0b (LoR P1-P2 diff; p = .36). At 16 yrs, an additional 5.2/100 HiR patients had events as a result of 1 preventive visit per yr, in contrast to 2. In the first 11 yrs of monitoring, HiR patients displayed no difference in the event rate based on the frequency of preventive visits (p = .261). The trends between the 2 slopes were not different (p = .76).c

