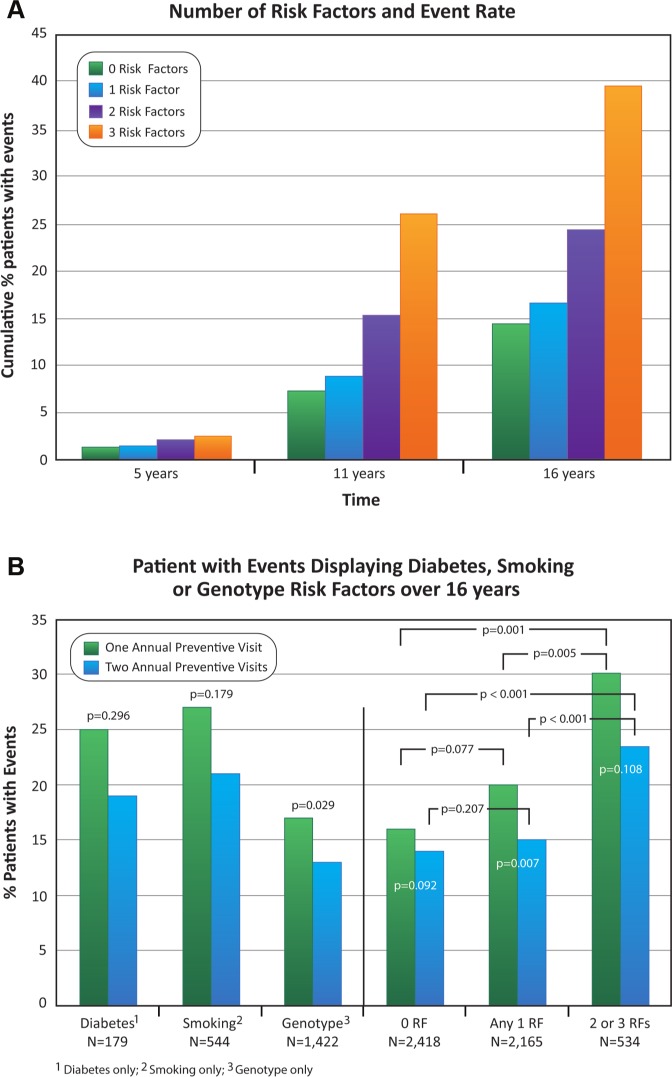
Figure 3.
Frequency of tooth loss events in patients relative to the number of risk factors. Panel A shows that the increasing numbers of risk factors at 5 yrs were not significant (trend p = .168), while from years 11 to 16 the trend was significant with increasing numbers of risk factors (p < .001). In Panel B, event rates were not different by preventive visit frequency for patients with diabetes alone or smoking alone (p = .296 and p = .179, respectively), whereas event rates for patients with the IL-1 genotype alone differed by frequency of preventive visits (p = .029). In patients with any 1 risk factor, 1 annual preventive visit increased the event rate in contrast to 2 (p = .007). Among all patients with 1 preventive visit annually, having any 1 risk factor in contrast to 0 did not increase event rate (p = .077), but having 2 or 3 risk factors increased the event rate in contrast to 0 (p < .001) and 1 risk factor (p = .005). Findings were similar among patients with 2 preventive visits annually, for 1 risk factor in contrast to 0 (p = .207), and for 2 or 3 risk factors in contrast to 0 (p < .001) and 1 risk factor (p < .001).

