Figure 3.
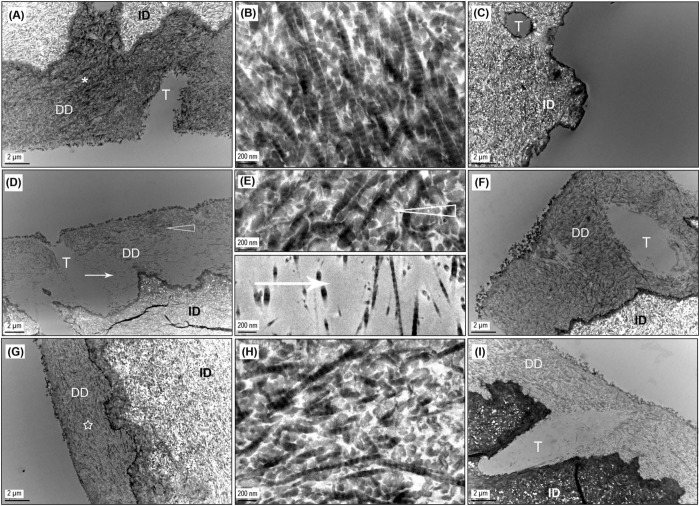
Representative TEM images of control and PA-treated specimens. DD, demineralized dentin; ID, intact dentin; T, dentinal tubule. (A) Undigested control with demineralized dentin layer. (B) High-magnification view of the demineralized dentin depicted by the asterisk in 3(A), showing the characteristic banding pattern of collagen fibrils. (C) Control, uncross-linked, after 1 hr of bacterial collagenase digestion, showing the depletion of demineralized collagen. (D) Dentin sample treated with the lowest dose of PA (3.75 wt% PA for 5 sec) and then subjected to 1 hr of collagenase digestion, the unusual and only instance where voids (arrow) were seen within sound demineralized collagen (open arrowhead) following digestion. (E) High-magnification view of the areas indicated by open arrowhead and arrow in 3(D), showing a more scarce distribution of collagen fibrils in voids than in the sound demineralized dentin. (F) Dentin sample treated with the highest dose of PA (15 wt% PA for 30 sec) and then subjected to 1 hr of digestion with collagenase, representing the more typical morphology of PA-treated demineralized layer following 1 hr of digestion. (G) Dentin sample treated in the same conditions as in 3(D) but digested with collagenase for 16 hrs. The inconsistency with 3(D) is attributed to the inter-specimen difference caused by non-uniform dispersion of PA in the demineralized layer under the lowest dose condition. (H) High-magnification view of the area indicated by a star in 3(G), showing that demineralized collagen remained intact after 16 hrs of collagenase digestion once cross-linked by PA. (I) Dentin sample treated in the same conditions as 3(F) but digested for 16 hrs, exhibiting an unchanged morphology compared with that after 1 hr of digestion with collagenase (3F), which is typical for PA-treated samples.

