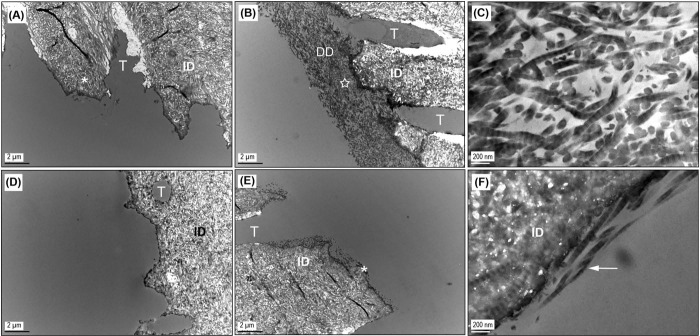
Figure 4.
Representative TEM images of GA-treated samples. DD, demineralized dentin; ID, intact dentin; T, dentinal tubule. (A) Dentin sample treated with the lowest dose of GA (2.5 wt% GA for 5 sec) and then subjected to 1 hr of bacterial collagenase digestion, showing the disappearance of demineralized collagen. The apparent inconsistency with the SEM result (Fig. 2A) was attributed to inter-specimen differences at the lowest dose condition. (B) Dentin sample treated with the highest dose of GA (10 wt% GA for 30 sec) and subjected to 1 hr of digestion with collagenase, representing all other GA-treated dentin except the lowest dose following 1 hr of digestion. (C) High-magnification view of the spot indicated by a star in 4(B). (D) Dentin sample treated in the same conditions as 4(A) but digested with collagenase for 16 hrs. (E) Dentin sample treated in the same conditions as 4(B) but digested with collagenase for 16 hrs, showing that GA-treated samples could not sustain 16 hrs of digestion. (F) High-magnification view of the area depicted by an asterisk in 4(E), emphasizing the remaining collagen fibrils (arrow) as seen in 2(F).

