
Figure.
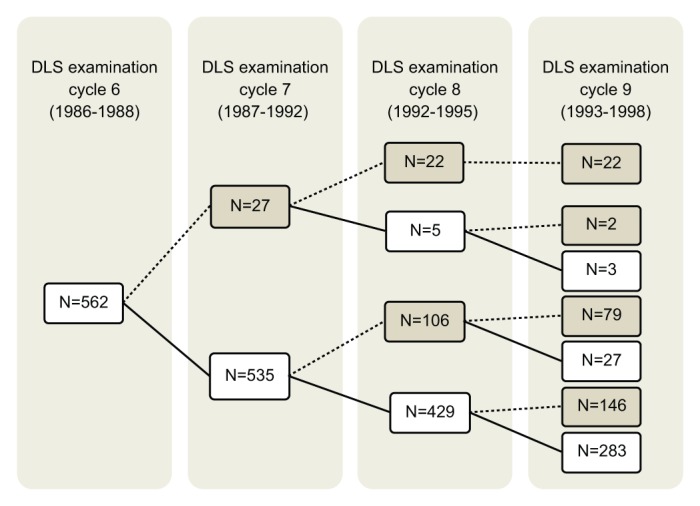
Flowchart of periodontal examination time periods and numbers of men who participated at each examination. Solid lines and numbers in white rectangles indicate numbers of men who did attend an examination cycle, whereas dotted lines and numbers in gray rectangles indicate numbers of men who did not attend. Twenty-two men attended only 1 examination, 81 attended 2 examinations, 176 attended 3 examinations, and 283 men attended all 4. DLS, Dental Longitudinal Study.