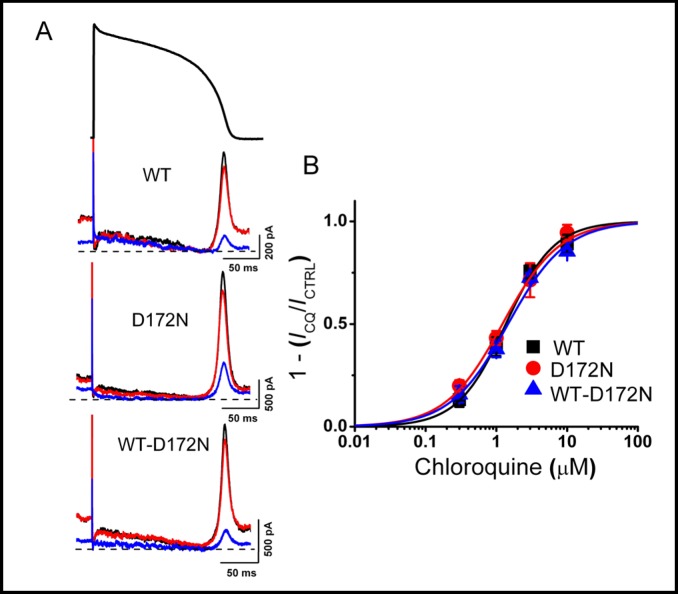
Fig. 1.
Concentration-response relationships for chlorquine inhibition of WT and mutant Kir2.1 current. A, Representative WT and mutant Kir2.1 currents elicited by action potential command signals as voltage protocol, before (black traces) and after application of 0.3 (red traces) and 3 (blue traces) µM chloroquine. B, Concentration-response relationship for WT and mutant Kir2.1 current inhibition. Steady-state peak-current amplitudes (shown in A) for each concentration of chloroquine normalized to control. Mean values were plotted against chloroquine concentration and fitted with the Hill equation (IC50 was 1.4 ± 0.1 µM with a Hill coefficient of 1.3 for WT, 1.2 ± 0.1 µM with a Hill coefficient of 1.1 for D172N and 1.5 ± 0.2 µM with a Hill coefficient of 1.1 for WT-D172N Kir2.1 current (n = 5 cells).

