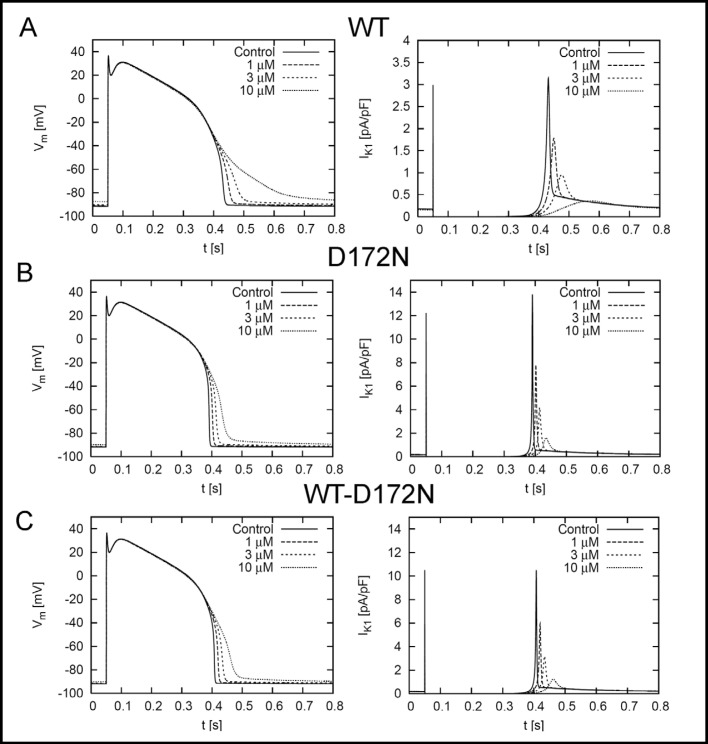
Fig. 5.
Left panel, simulated transmembrane voltages of an epicardial myocyte for (A) WT, (B) D172N and (C) WT-D172N simulations at stimulation frequencies of 1 Hz under control conditions and the indicated chloroquine concentrations. The stimulus was applied at t = 50ms. Right panels, simulated IK1 elicited during action potential for WT, D172N and WT-D172N simulations at indicated chloroquine concentrations.

