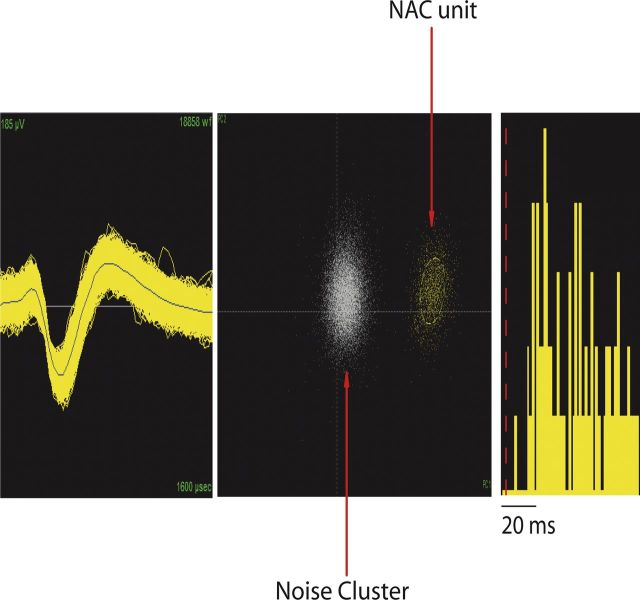
Figure 7.
Example of neuron isolated from NAc. From left to right, Depiction of the extracellularly recorded waveform of the unit (x-axis, 1600 μs; y-axis, 185 μV), projection of the clusters corresponding to the unit and the noise based on analysis of the first two principal components of the waveforms recorded (x-axis, PC1; y-axis, PC2), and interspike interval histogram.

