
Figure 3.
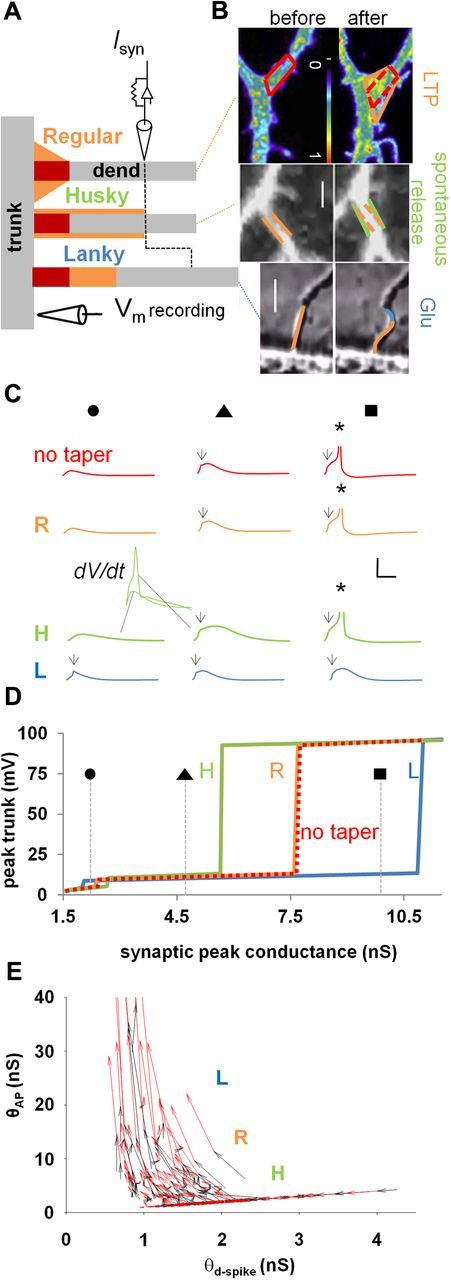
Potential functional effects of bifurcation morphological dynamics. A, Top, Regular, typical morphology. Middle, In the husky morphology, the tapering surface is redistributed to increase the dendritic diameter from the branch point up to the synaptic location. Bottom, In the lanky morphology, the tapering surface is used to increase the distance of the synaptic input from the branch point. In all cases, red indicates the membrane portion without a tapering surface; gray and black symbols schematically show the location of the synaptic input on the dendrite and of the recording electrode in the trunk, respectively. B, Top, Branch-point exocytosis of transferrin receptor (TfR)-pHluorin after glycine-induced LTP in rat CA1 pyramidal neuron. TfR-pHluorin fluorescence was imaged before or 20 min after glycine stimulation. The bar (10 μm) is a pseudocolor intensity scale. Image reproduced with permission from Park et al. (2006). Orange and red lines highlight the contour of the branch-point tapering region before (left, no taper) and after (right, regular) LTP induction. Middle, Imaging of CA1 pyramidal neuron dendrites during spontaneous activation at time 0 (left) and 60 (right) min. Green and orange lines show a regular-to-husky transformation. Scale bar, 1 μm. Bottom, Response of a rat CA1 pyramidal neuron in a cell culture to a pulse of glutamate applied from a micropipette. Orange and blue lines depict the transformation from regular to lanky. Scale bar, 5 μm. Middle and bottom images are snapshots from the videos described by Smith and Jahr (1992), courtesy of Dr. S. Smith (Stanford University, Palo Alto, CA). C, Trunk voltage traces for four tapering shapes (without tapering membrane in red, regular in orange, husky in green, lanky in blue). Insets in middle plots represent trunk dV/dt in the absence or presence of a local spike. Symbols on top represent specific synaptic strengths, indicated in D. Arrows and asterisks indicate d-spike and AP, respectively. D, Trunk peak voltage as a function of synaptic peak conductance shows the compartmentalization associated with husky (H), regular (R), and lanky (L) branch points. E, Effect of changing branch-point morphology on θd-spike and θAP. Black arrows show husky-to-regular changes; red arrows depict regular-to-lanky effects. For the simulations of the branch point illustrated in this figure, the synaptic input was at 38 μm from the branch point for the regular and husky configurations and at 42.51 ± 5.25 μm (mean ± SD) for the lanky case.