Figure 5.
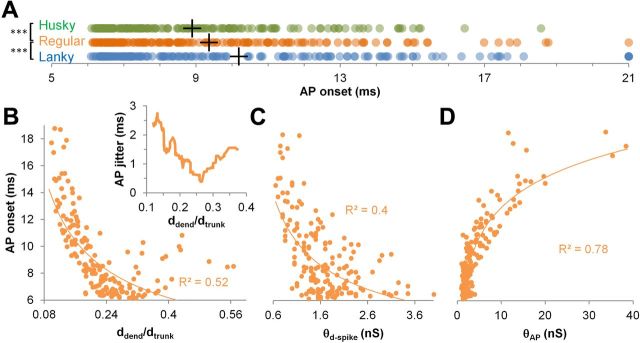
Temporal consequences of branch-point morphology variation. A, AP delay onset for husky (H, green), regular (R, orange), and lanky (L, blue) dendrites (+ symbols are averages; ***p < 10−5, 1-tailed paired t test). B, Effects of ddend/dtrunk diameter ratio on onset and jitter (inset) in regular branches. AP onset jitter was calculated as the AP onset SD over a sliding window of 20 branches. Line in the main figure is a power fit. C, Power relationships between d-spike threshold and AP onset in regular branches. D, Logarithmic relationship between AP threshold and onset in regular branches. BP, Branch point.

