
Figure 2.
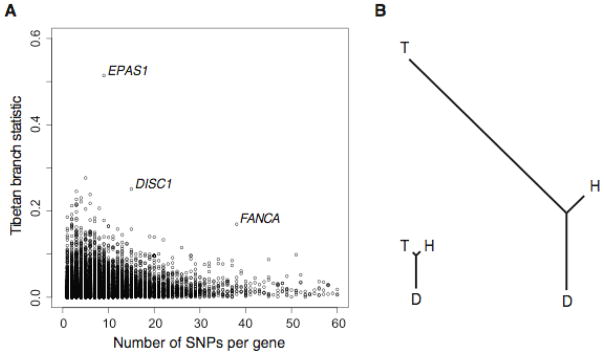
Population-specific allele frequency change. (A) The distribution of FST-based PBS statistics for the Tibetan branches, according to the number of variable sites in each gene. Outlier genes are indicated in red. (B) The signal of selection on EPAS1: Genomic average FST-based branch lengths for Tibetan (T), Han (H), and Danish (D) branches (left), and branch lengths for EPAS1, indicating substantial differentiation along the Tibetan lineage (right)