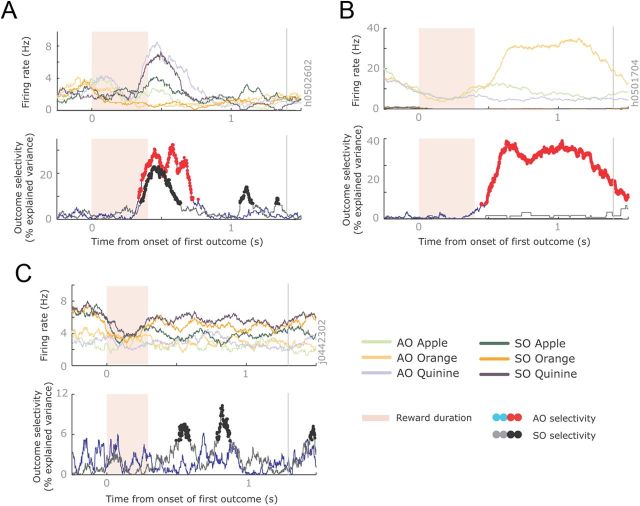
Figure 3.
Example neurons with different outcome selectivity. A, Spike density histogram illustrating an OFC neuron encoding the first reward across both tasks. It had its highest firing rate when the reward was quinine (blue lines) and its lowest firing rate when the reward was orange juice (orange lines). This neuron was recorded from subject H, and so the ordering was the inverse of this subject's preferences. The magnitude of outcome selectivity, defined as the percentage of variance in the neuron's firing rate attributable to the outcome, is shown below the histogram. Significant encoding is denoted with red and black dots in the AO and SO tasks, respectively. The gray vertical line illustrates the end of the delay period. B, An ACC neuron that encoded outcomes only in the AO task. (The activity on the SO task was so low that it is barely visible on this plot.) This neuron was recorded from subject H and the ordering of the juices reflected the subjects' preferences. C, An OFC neuron that encoded outcomes only in the SO task. This neuron was recorded from subject J and was the inverse of the subject's preferences.

