
Figure 1.
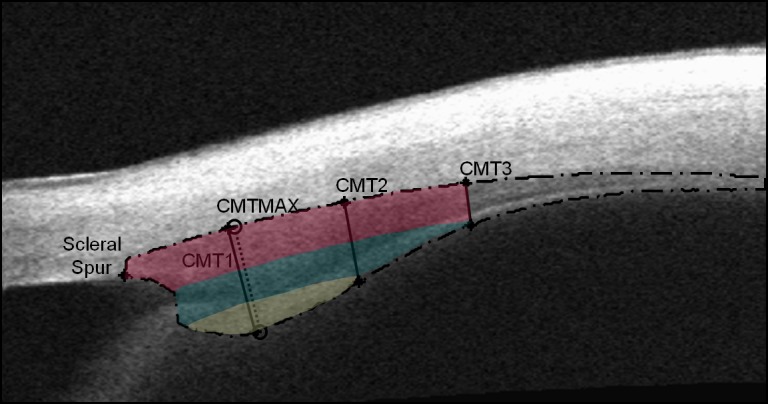
Anterior segment optical coherence tomography image of the ciliary muscle. The long-dashed line indicates the outline of the ciliary muscle. The measurement locations of CMT1, CMT2, and CMT3 are labeled with solid lines. The measurement location of CMTMAX is labeled with a short-dashed line. The image was color-enhanced to show how it would be divided if various CMT measurements were subtracted from other regions. The dark pink shading indicates the thickness of CMT3 throughout the muscle. The thickness of CMT2 is indicated by the addition of the dark pink region to the teal region. Finally, the remaining area shaded yellow would be specific to the region where the apical fibers at CMTMAX and CMT1 would be measured.