Figure 2.
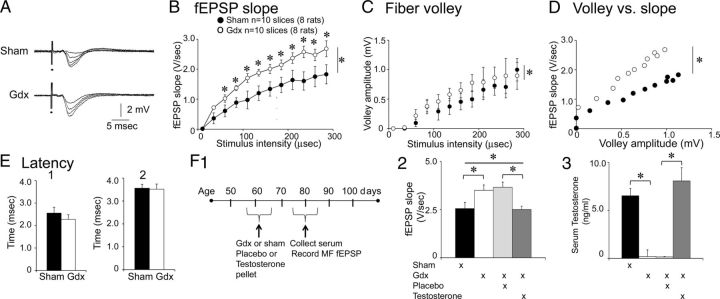
Slices from Gdx rats exhibit larger MF fEPSPs than sham rats. A, Representative examples of MF fEPSPs are shown for a sham (top) and Gdx rat (bottom) that had surgery ∼2 weeks previously. The responses to a range of stimulus intensities are superimposed. B, The input-output relation is shown for MF fEPSP slope from sham (black) and Gdx (white) rats. Gdx rats had significantly greater fEPSP slopes by two-way RM-ANOVA: *p < 0.05 (asterisk to the right of the vertical bar; asterisks above data points denote significance after post hoc tests; for this and all other figures, all statistical comparisons are provided in the text). C, The input-output relation is shown for fiber volleys from the same sham and Gdx rats. Differences were significant by ANOVA 4-parameter linear regression analysis (p < 0.001). D, MF fEPSP slope is plotted against fiber volley amplitude for the same data. The slopes were significantly different: *p < 0.05 (ANCOVA). E, The mean latencies to (1) the onset of the fiber volley and (2) the onset of MF fEPSPs (evoked by a minimal stimulus) are shown; differences were not significant (Student's t test, p > 0.05). F1, A schematic illustrates the experimental timeline for Gdx rats that were implanted with a subcutaneous pellet containing testosterone or placebo. Comparisons were made to sham and Gdx rats that were untreated. F2, Comparison of MF fEPSP slope showed group differences: *p < 0.05 (asterisk over the bar, one-way ANOVA). Gdx rats that were untreated (white) had significantly greater fEPSP slopes than sham rats that were untreated (black): *p < 0.05 (asterisk over the bracket; post hoc test). Gdx rats treated with placebo (light gray) had significantly greater fEPSP slopes than Gdx rats treated with testosterone (dark gray): *p < 0.05 (asterisk over the bracket; post hoc test). fEPSPs in slices of Gdx rats treated with testosterone were similar to sham rats. Gdx rats that were treated with placebo (dark gray) were similar to Gdx rats that were untreated (white): p > 0.05 (post hoc tests). F3, ELISA showed that serum testosterone levels were at the lower limit of the assay for placebo and untreated Gdx rats. Differences between sham rats and Gdx rats treated with testosterone were not significant (Kruskal–Wallis ANOVA, followed by post hoc test, p > 0.05), suggesting that testosterone administration restored testosterone levels to a comparable range as sham rats. Differences between untreated sham and untreated Gdx rats were significant; differences between Gdx rats treated with placebo and Gdx rats treated with testosterone were also significant: *p < 0.05 (asterisks above the brackets; Kruskal–Wallis ANOVA followed by post hoc tests).

