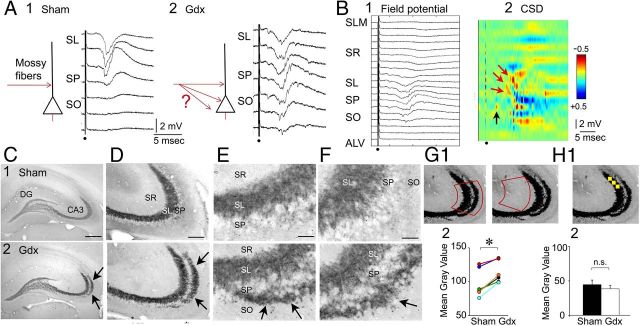
Figure 9.
Gdx in adult male rats leads to MF sprouting in stratum oriens of CA3a/b. A1, Left, A schematic illustrates the MF pathway (red) in a sham rat. Right, Representative responses to a fixed MF stimulus are shown for a slice of a sham rat. A1, A2, Only those responses between stratum lucidum and stratum oriens are shown. A2, Left, An illustration of the MF pathway in a Gdx rat where MFs may sprout into stratum oriens (red arrows with question mark). Right, Responses of a slice from a Gdx rat recorded in a similar manner to A1. Responses are similar in stratum lucidum, pyramidale, and oriens and appear to be fEPSPs. B, All field potentials (B1) and CSD (B2) are shown for the Gdx rat in A2. Red arrows point to current sinks in or near stratum lucidum. The black arrow corresponds to a fiber volley in stratum oriens, suggesting that MF axons were present in stratum oriens. C–F, Dynorphin-ir in a sham (1) and Gdx (2) rat. D–F, Arrows point to the area of stratum oriens where dynorphin-ir is evident in the Gdx rat but not the sham rat. DG, Dentate gyrus; SR, stratum radiatum; SL, stratum lucidum; SP, stratum pyramidale; SO, stratum oriens. Scale bar: C, 500 μm; D, 100 μm; E, F, 25 μm. G1, Left, The template (red) that was used to measure dynorphin-ir in CA3 is shown. Right, To estimate background staining, the template was positioned over stratum radiatum as shown. For each section, the mean grayscale value for the background was subtracted from the mean grayscale value of the first measurement. G2, Animals were prepared in pairs (same surgery date, same perfusion date, immunocytochemical processing at the same time), and results are shown for each pair (left, sham; right, Gdx). The Gdx rats exhibited a greater mean grayscale value: *p < 0.05 (paired t test). H1, The yellow box that was used to determine mean grayscale values of the terminal field of MFs is shown. Three measurements within the area of the terminal plexus, depicted by three boxes, were averaged for each section. Three measurements in stratum radiatum were also made, to estimate background staining, and the mean of these measurements was subtracted from the mean of the stratum lucidum measurements for H2. H2, The mean grayscale value was similar in sham and Gdx rats (not significant [n.s.]; p > 0.05; paired t test). The results suggest that dynorphin-ir in stratum oriens of Gdx rats was the result of new dynorphin-ir fibers, not increased dynorphin-ir in preexisting fibers.

