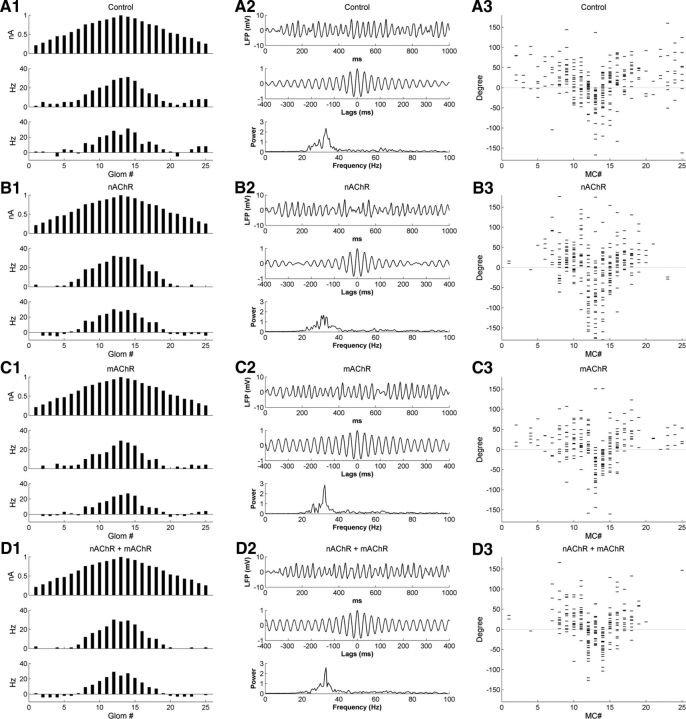
Figure 13.
Cholinergic neuromodulation in the full model with lower PGC→MC synaptic weight and higher GC→MC synaptic weight. The PGC→MC synaptic weight was reduced from 8 to 5 and the GC→MC synaptic weight was increased from 1 to 2. A1, Histograms of activity in all 25 glomeruli under control conditions, arranged according to their levels of afferent activation for ease of visualization. Top, Steady-state OSN input levels; middle, odor-evoked spike rates in MCs; bottom, odor-coding spike rates in MCs (see Materials and Methods). A2, Simulated LFP (top) during odor presentation, with autocorrelation (middle) and power spectrum (bottom), under control conditions. A3, Raster plot of MC spike phases with respect to sLFP oscillations, under control conditions. B1–B3, As in A1–A3, but with nicotinic cholinergic neuromodulation active. C1–C3, As in A1–A3, but with muscarinic cholinergic neuromodulation active. D1–D3, As in A1–A3, but with both nicotinic and muscarinic cholinergic neuromodulation active.

