Figure 5.
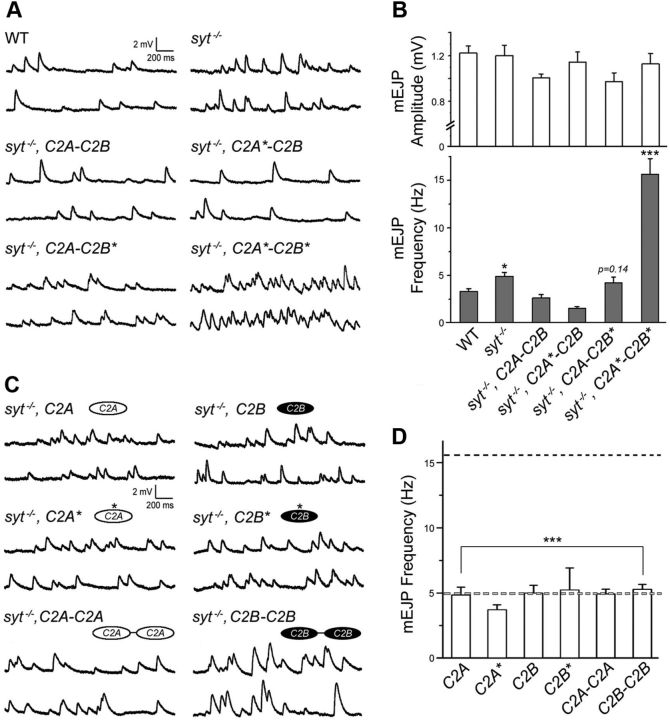
Contributions of Syt1 C2 domains to spontaneous synaptic release. A, Representative mEJPs recorded in the presence of low [Ca2+]o (0.2 mm) are shown for wild-type, syt1−/− (null), and syt1−/− rescued with the indicated transgenic constructs. Calibration: 2 mV, 200 ms. B, Summary data for mean mEJP amplitude (top) and frequency (bottom) are shown for the indicated genotypes. Data are mean ± SEM. ***p < 0.001 and *p < 0.05, one-way ANOVA with multiple comparison using the Fisher's LSD test between syt1−/− rescued with the C2A-C2B and the indicated genotypes. Number of NMJs examined: WT, 5; syt−/−, 19; syt−/−, C2A-C2B, 15; syt−/−, C2A*-C2B, 8; syt−/−, C2A-C2B*, 11; and syt−/−, C2A*-C2B*, 11. C, Representative mEJPs are shown for syt1−/− rescued with isolated C2 domains (C2A or C2B), with or without mutations in Ca2+-binding residues, or with dual C2A (C2A-C2A) or C2B (C2B-C2B) domains. D, Summary of mean mEJP frequency is shown for the indicated genotypes. The levels measured in syt1 null mutants (light gray) and syt1−/− rescued with Ca2+-binding defective C2A*-C2B* (black) are indicated with dotted lines. ***p < 0.001, one-way ANOVA analysis with multiple comparisons using the Fisher's LSD test between C2A*-C2B* (black dashed line) and the indicated genotypes. Number of NMJs examined: syt−/−, C2A, 5; syt−/−, C2A*, 6; syt−/−, C2B, 5; syt−/−, C2B*, 5; syt−/−, C2A-C2A, 7; and syt−/−, C2B-C2B, 18.

