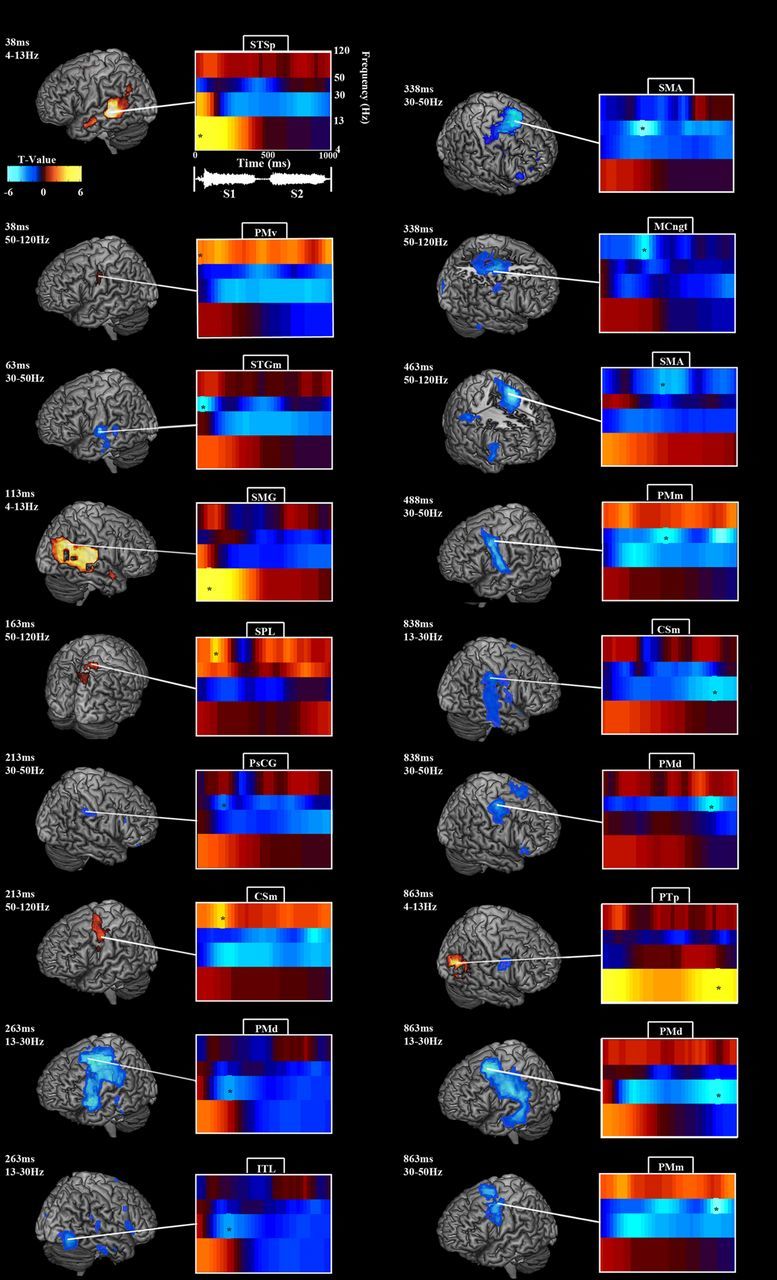
Figure 2.

Oscillatory modulations during syllable encoding. All brain-rendering/spectrogram pairs follow the pattern detailed in the example in the top left corner. Each brain rendering depicts statistically significant activations for a single time point in a particular frequency band, indicated by an asterisk on the accompanying spectrogram. The spectrogram, in turn, displays the power time courses across frequency bands for the peak voxel in the brain rendering, indicated by a white line. Time 0 marks the onset of the first syllable, which ends at ∼470 ms. The second syllable begins at ∼520 ms and ends at ∼990 ms. θ/α power peaked over bilateral auditory areas early, followed by β and LγP decreases over bilateral auditory and premotor areas and HγP increases over left premotor cortex. For details, see Results and Table 1.
