
Figure 3.
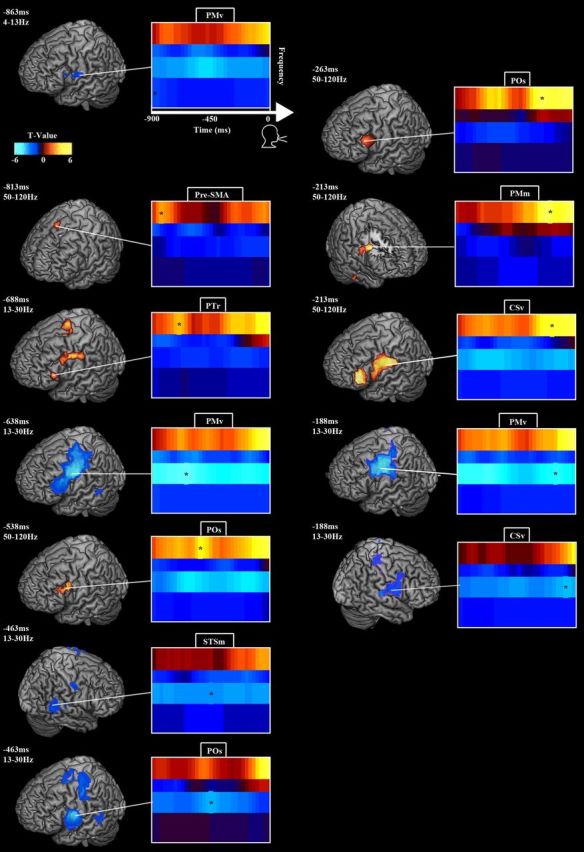
Oscillatory modulations during syllable speech preparation. Figure layout follows Figure 2. Time 0 marks voice onset. β power decreased and HγP increased over PTr and SMA early in the pre-response period, followed by HγP in POs, and as voice onset approached bilateral β power decreased and HγP increased in PM. For details, see Results and Table 2.