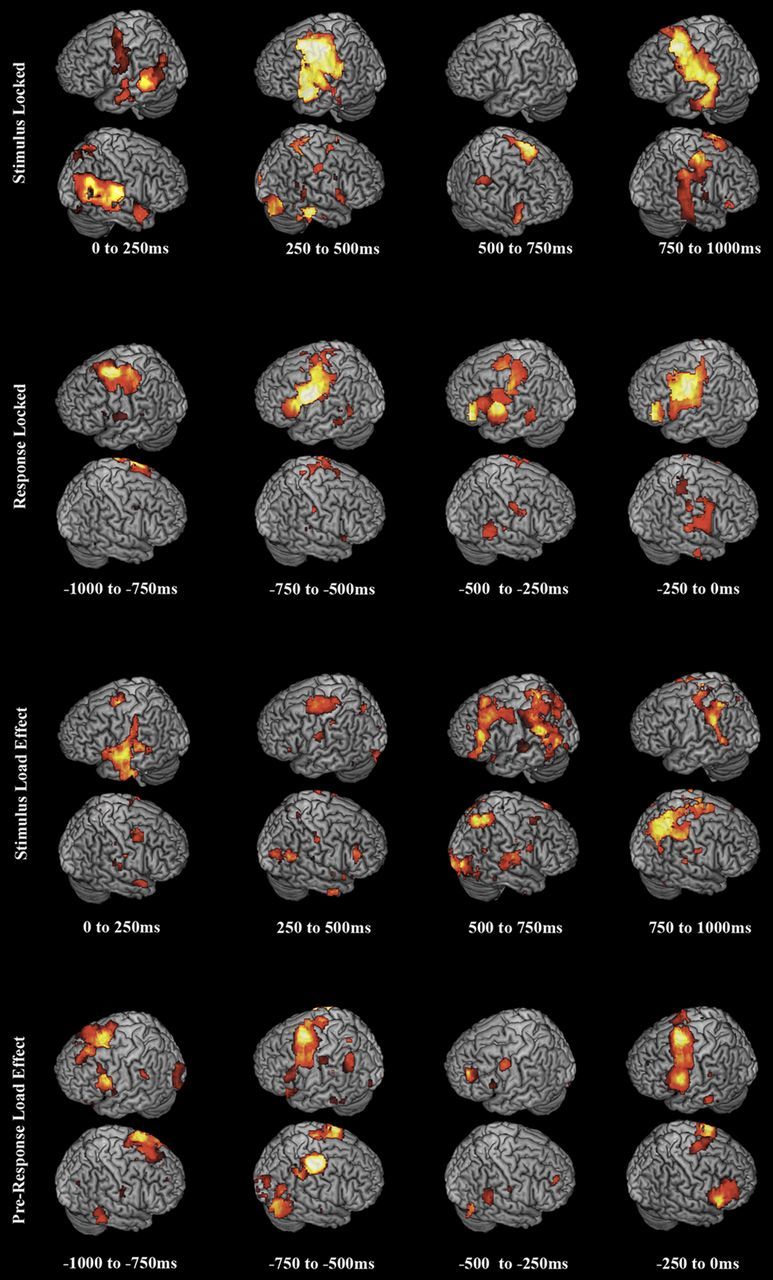
Figure 7.

Summary figure depicting phonological loop network activations across all conditions. Brain renderings depict all θ, α, and β power decreases and HγP increases overlaid as activations, with absolute t values rendered additively. Activations and load effects oscillated between frontal and posterior regions of the dorsal speech stream. See Results and Discussion.
