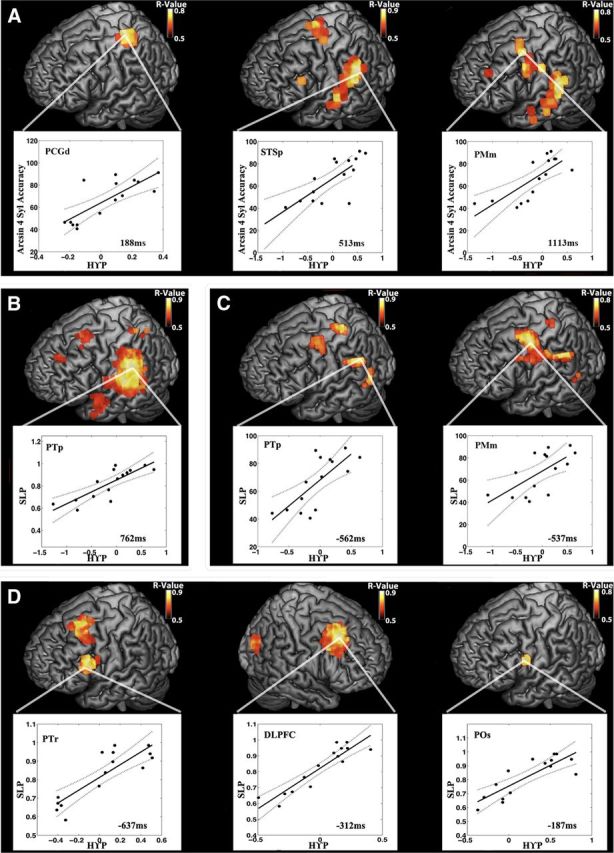
Figure 8.

Peak HγP performance correlations across stages of speech reproduction. For A–D, each brain rendering depicts the correlation at the time point indicated in the associated scatter plot, which depicts the individual subject data. In scatter plots, solid lines represent the best least-squares fit, and dotted lines represent the 95% confidence intervals. A, Stimulus period: peaks of correlation between whole-brain stimulus onset-locked HγP and normalized four-syllable accuracy occur at 190 ms in PCGd, 525 ms in STSp, and 1125 ms after stimulus in PMm. B, Stimulus load effect: the whole-brain correlation between the four/two-syllable stimulus Hγ contrast and the load performance metric peaks halfway through the syllable contrast at 262 ms after sound onset in PTp. C, Pre-response period: peaks of correlations between whole-brain response onset-locked HγP and normalized total accuracy occur at 562 ms in PTp and 525 ms in PMm pre-response. D, Pre-response load effect: peaks of correlations between whole-brain four/two-syllable Hγ contrast and load performance occur at 637 ms in left PTr, 312 ms in right DLPFC, and 187 ms in left POs pre-response.
