Figure 6.
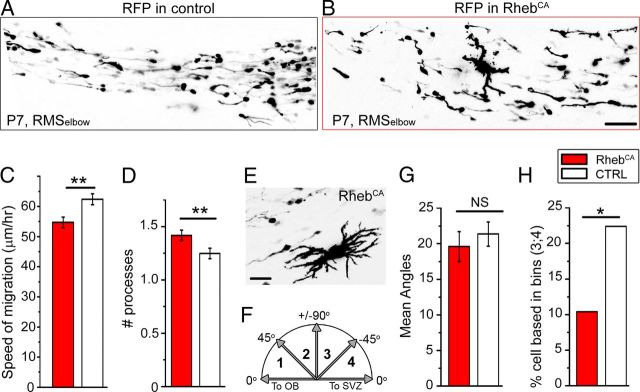
RhebCA-expressing neuroblasts display altered direction and reduced speed while passing stationary giant cells. A, B, Confocal image of RFP+ cells coexpressing GFP (not shown) or RhebCA in the RMSelbow of a sagittal section from a P7 mouse. C, D, Bar graphs of the mean ± SEM speed of migration (C) and the mean number of processes per cell (D) in control (white) and RhebCA (red) condition. E, Example of a cytomegalic, giant RhebCA-expressing cell. F, Diagram showing the four bins used to compare the angles of the processes. G, H, Bar graphs of the mean angles of the processes (G) and the mean percentage of cells in the quadrants compared with the 0–90 ° quadrant. Scale bars: B, 60 μm; E, 50 μm. *p < 0.05; **p < 0.01.

