
Figure 7.
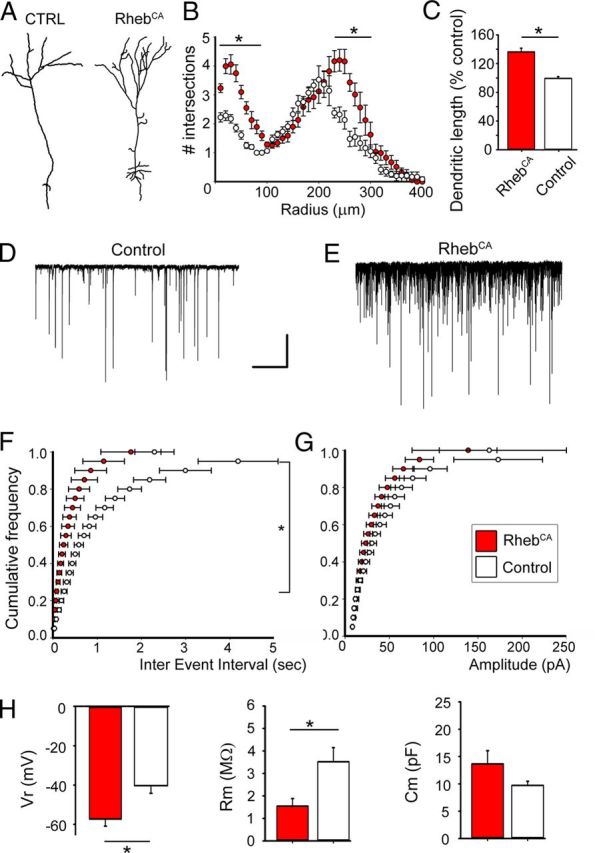
RhebCA leads to a hypertrophic dendritic tree and associated synaptic and biophysical changes. A–C, Tracing of a representative control and a RhebCA-expressing granule neuron (A), corresponding Sholl analysis (B), and bar graphs of the mean dendritic length (C; red: RhebCA, N = 6; white: control, N = 4). D, E, Patch-clamp recording of sPSCs in control (D) and RhebCA (E) granule neurons. Calibration: 10 s, 50 pA. F, G, Corresponding cumulative plots of the frequency (F) and amplitude (G) of synaptic currents (white, control; red, RhebCA). H, Bar graphs of the resting potential (Vr), membrane resistance (Rm), and membrane capacitance of RhebCA (red) and control (white) granule neurons. *p < 0.05.