
Figure 8.
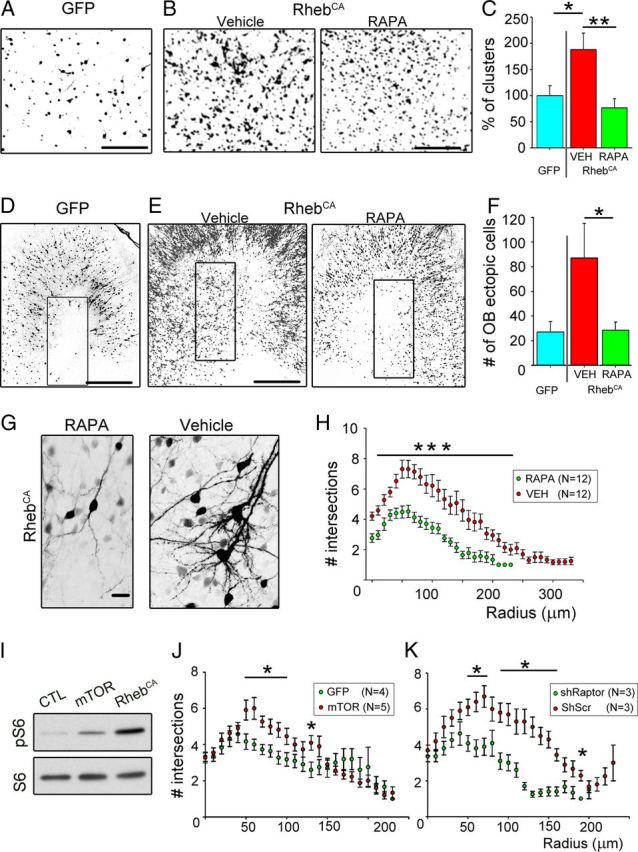
OB heterotopia, micronodules, and dendrite hypertrophy are mTOR dependent. A, B, Images taken in a medial sagittal section of the OB illustrating cells forming micronodules in the vehicle condition compared with the rapamycin condition (B) and control (GFP instead of RhebCA) conditions (A). In the rapamycin and vehicles, cells were electroporated with RhebCA. C, Bar graphs of the percentage of micronodules (or clusters) in the RhebCA condition with vehicle (red) or rapamycin (green) normalized to the GFP-electroporated condition (blue). D, E, Images of ectopic GFP- or RhebCA-containing cells in or outside the RMSOB in sagittal sections. The rectangles highlight the analyzed regions. F, Bar graphs of the number of ectopic cells in the OB in the GFP- (blue) and RhebCA-electroporated conditions with vehicle (red) or rapamycin (green). G, Images of RhebCA-expressing cells in the vehicle and rapamycin condition. H, Sholl analysis representing the number of intersections for the basal dendrites of RhebCA-expressing granule cells in vehicle (red)- and rapamycin (green)-treated mice at 19 dpe. I, Immunoblots of phospho-S6240/244 (pS6) and S6 from Neuro2a transfected with a control vector (GFP), mTOR-encoding, or RhebCA-encoding vector. CTL, Control. J, K, Sholl analysis of the number of intersections for the basal dendrites of GFP or shRaptor (green)-expressing and mTOR or shScramble (red)-expressing granule cells at 19 dpe. Scr, Scramble; RAPA, rapamycin. *p < 0.05, **p < 0.005, ***p < 0.001. Scale bars: A, B, 100 μm; D, E, 350 μm; G, 50 μm.