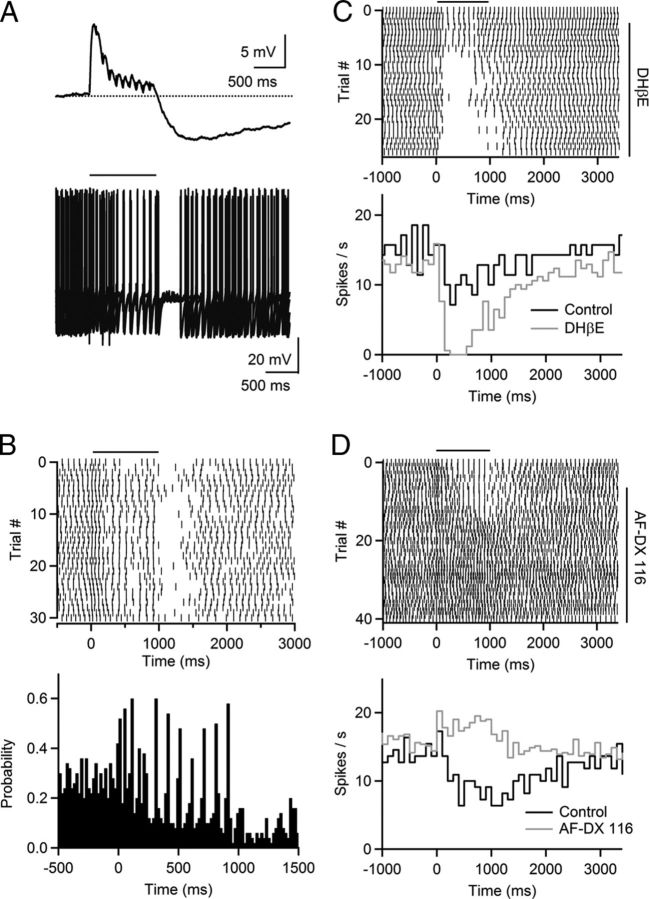
Figure 8.
Cholinergic synaptic inputs entrain TRN neuronal activity. Neurons were recorded with a K-based internal solution and held in current clamp. A, Top, Postsynaptic E–I response evoked by a brief stimulus train (10 stimuli, 10 Hz), for a TRN neuron held at −60 mV. Bottom, The same stimulus train (indicated by horizontal bar) was applied during ongoing action potential activity evoked by depolarizing current steps (6 s, 120 pA). Shown are five consecutive trials. B, Top, Raster plot showing the timing of spikes in consecutive trials during and following stimulus train (onset of synaptic stimulation at t = 0 ms) for same cell as shown in A. Bottom, Poststimulus time histogram (PSTH; bin size, 20 ms) compiled for 58 consecutive trials. C, In a different neuron, spike entrainment to cholinergic stimulation was eliminated by blocking nAChRs. Top, Raster plot showing timing of spikes during stimulus train (10 stimuli, 10 Hz) before and following bath application of the nAChR antagonist DHβE (3 μm). Bottom, PSTH (bin size, 100 ms) for spike firing in control (black) and following bath application of DHβE (gray). D, Block of spike entrainment by pharmacological block of M2 muscarinic receptors. Top, Raster plot showing timing of spikes during stimulus train (10 stimuli, 10 Hz) before and following bath application of the mAChR antagonist AF-DX 116 (10 μm). Bottom, PSTH (bin size, 100 ms) for spike firing in control (back) and following bath application of AF-DX 116 (gray).

