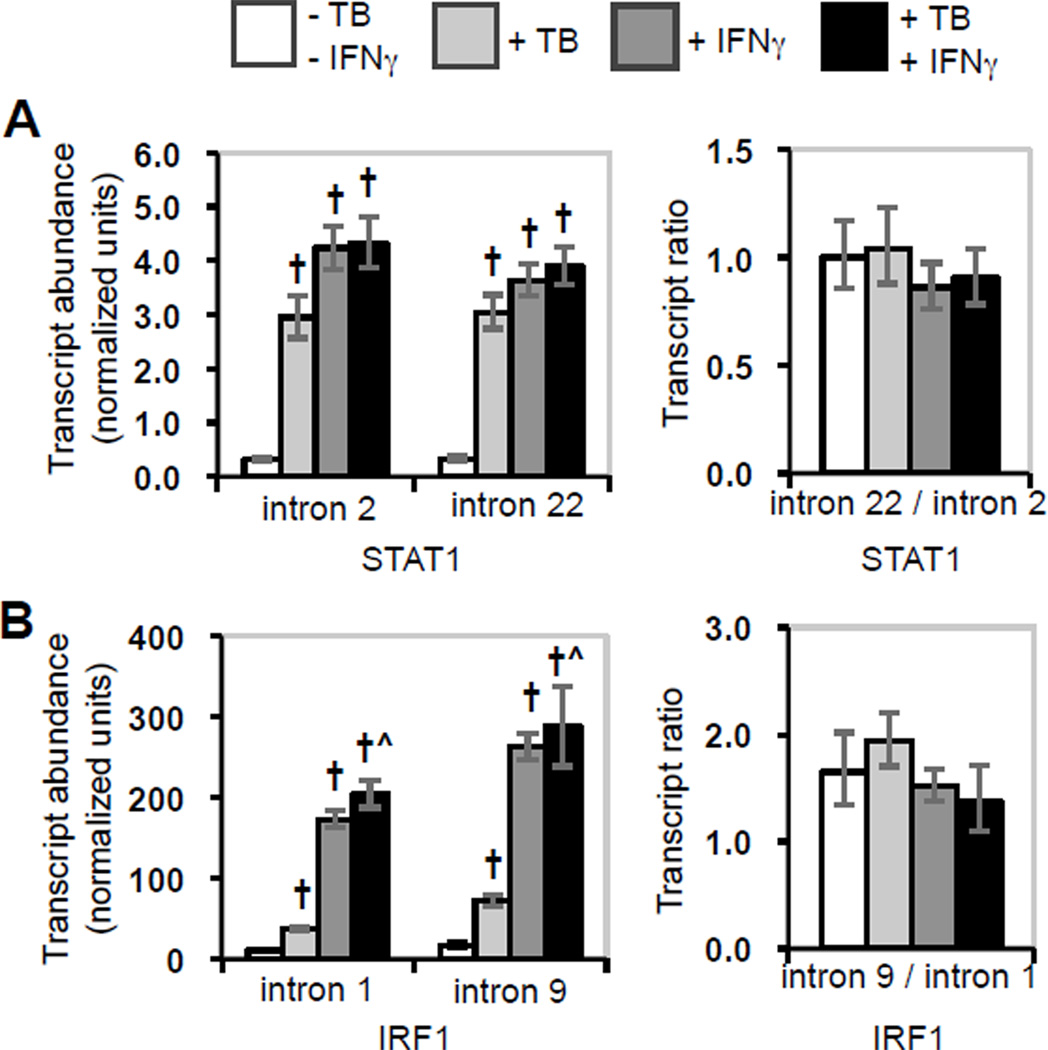
Figure 3.
Effects of M. tuberculosis infection and IFNγ stimulation on STAT1 and IRF1 transcript elongation. Intron sequences in total nuclear STAT1 and IRF1 transcripts were assayed. The average fold-induction of each target region is shown. Error bars represent ± SEM for each average and for the ratios. A) STAT1 intron 2 and intron 22. B) IRF1 intron 1 and intron 9. Statistically significant differences are indicated as described in the legend for Fig. 1.

