Figure 3.

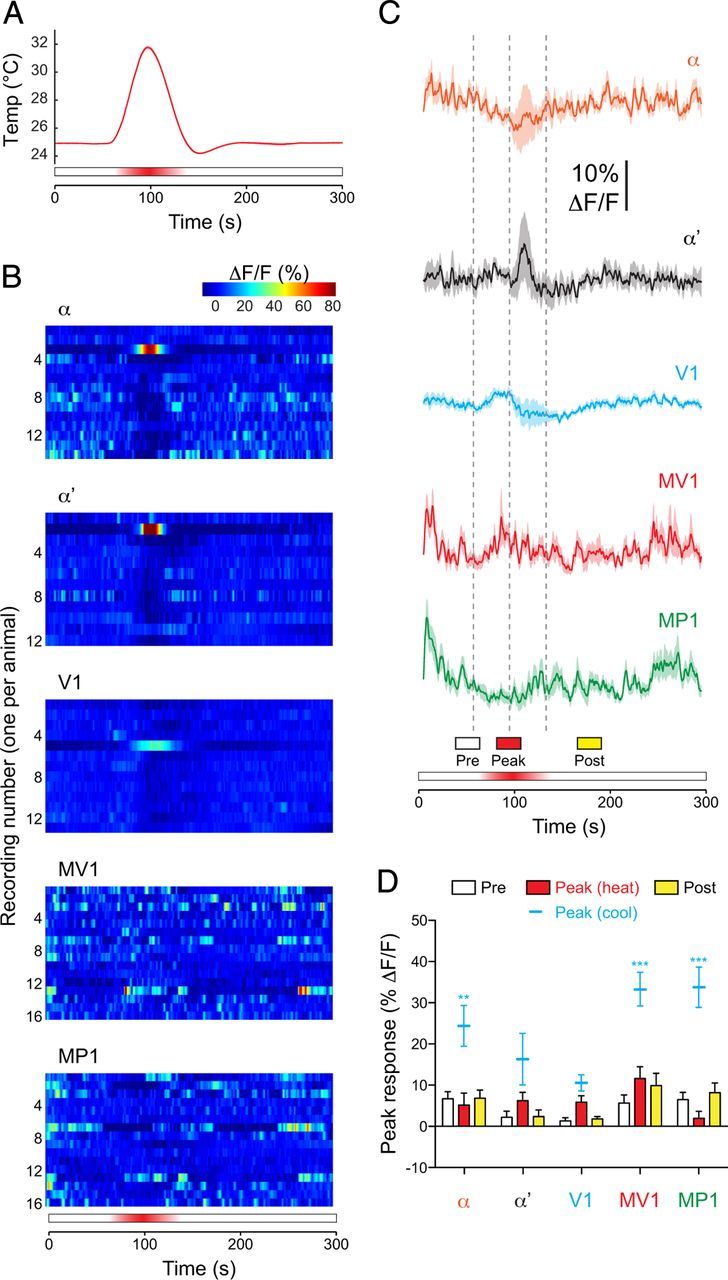
Dopaminergic neurons did not respond to increases in temperature. A, Temperature recorded next to the fly's head during brief heating experiments. Mean (dark red) ± SEM (light red surround) are graphed (n = 30). B, Heat maps of the responses of individual dopaminergic neurons (1 imaged per fly) to brief heating. C, Responses of each subset of dopaminergic neurons to brief heating. Mean (dark lines) ± SEM (light surrounds) are shown. Vertical dashed gray lines show the beginning, peak, and end of the temperature shift. D, Dopaminergic neuron responses to heat across three response windows. For comparison, peak responses to cooling are replotted (mean ± SEM, without bars) from Figure 1G. **p < 0.01, ***p < 0.001 (Bonferroni's test).
