Figure 3.
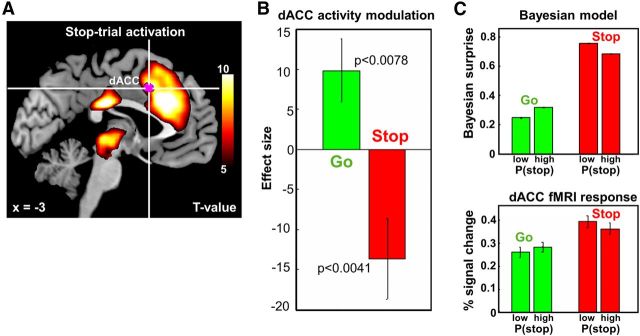
Model-based fMRI data analysis: coding of Bayesian surprise in the dACC. A, Hot color, Medial prefrontal cortex, including dACC and pre-SMA, as well as a cluster that includes the thalamus, epithalamus, and regions in the midbrain, is more activated during stop trials than go trials (p < 0.05, corrected for multiple comparisons, FWE). Violet color, The contrast of parametric modulators P(stop) of go trials − P(stop) of stop trials identifies a small cluster in the dACC (675 mm3, peak MNI coordinates [−3 14 40], Z-score = 4.67), bordering SMA, to be more positively modulated by P(stop) in go trials than in stop trials. T-value maps' contrasts are overlaid on structural images in sagittal section, and color bar represents voxel T-values (n = 66). B, Effect size of the parametric modulators P(stop) of dACC masks across 66 subjects (constructed using the first GLM), based on leave-six-out cross-validation. The dACC activity is positively modulated by P(stop) during go trials and negatively modulated during stop trials (p < 0.0078 and p < 0.0041, respectively). C, Top, Bayesian model simulation of surprise, |outcome − P(stop)|, for trials with low and high prior P(stop), each for go (positive correlation) and stop (negative correlation) trials. Bottom, Average PSC of dACC activity for go and stop trials across subjects for the second general linear model. The dACC masks are obtained using the first GLM, followed by a ROI analysis with leave-six-out cross-validation. There is significant increase of dACC activity for different bins across subject in go trials (paired t test, T = 2.004, p = 0.049); there is a significant decrease in stop trials (paired t test, T = 2.662, p = 0.010). We use MarsBaR (http://marsbar.sourceforge.net/) to compute the PSC in the ROI. Error bars indicate SD.

