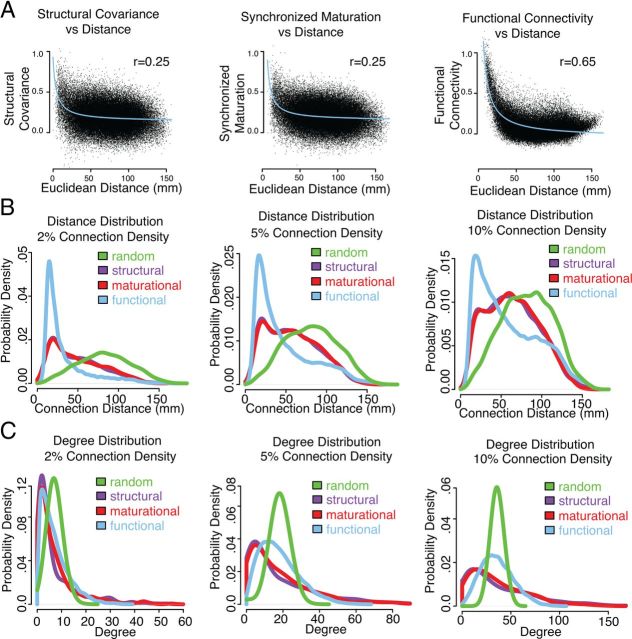
Figure 4.
Network profiles of edge connection distance and nodal degree distributions. A, Across all pairs of brain regions, connection distance is inversely proportional to structural covariance, synchronized maturational change, and functional connectivity. B, At three different connection densities, connection distance probability distributions for structural, maturational, functional, and benchmark random networks. C, At three different connection densities, nodal degree probability distributions for structural, maturational, functional, and benchmark random networks.

