Figure 2.

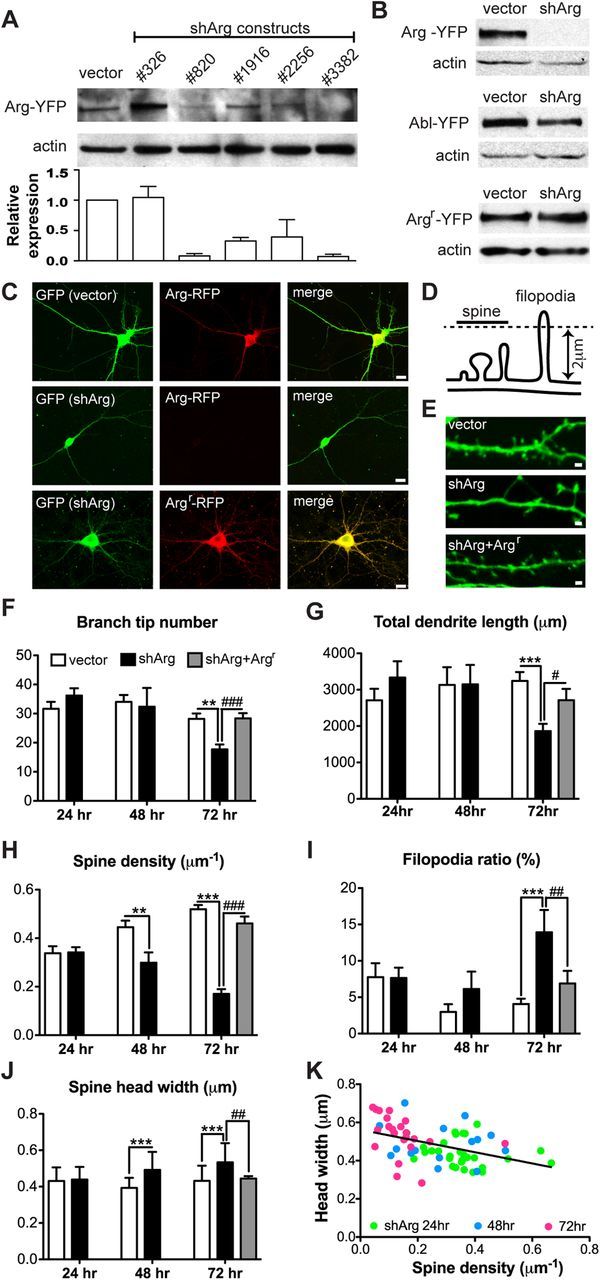
Arg knockdown collapses dendrite arbors and destabilizes dendritic spines. A, Immunoblot analyses of Arg knockdown in HEK-293 cells. Cells were transfected with control vector or five different shRNA constructs together with Arg-YFP to determine Arg knockdown efficiency. shArg3382 (shArg) had the highest knockdown efficiency and was used for the following experiments. B, HEK-293 cells were cotransfected with control vector or shArg together with Arg-YFP, Abl-YFP, or Argr-YFP for 72 h. shArg efficiently knocks down Arg-YFP, but not the related Abl-YFP or Argr-YFP. C, Confocal images of cultured hippocampal neurons transfected with control vector or shArg. Neurons were cotransfected with Arg-RFP or Argr-RFP at 12 DIV and fixed 72 h after transfection. Neurons were immunostained with antibodies to GFP and RFP. shArg, but not the control vector, knocks down Arg-RFP in cultured neurons. Note that the dendrite arbors are smaller in neurons treated with shArg alone. Scale bar, 10 μm. D, Illustration shows the criteria for distinguishing dendritic spines and filopodia. E, Confocal images of dendritic spines from neurons transfected with control vector, shArg, or shArg with Argr. Scale bar, 1 μm. F–I, Averaged dendrite branch tip number (F), total dendrite length (G), spine density (H), and filopodia ratio (I) of neurons transfected with vector or shArg analyzed at 24, 48, and 72 h after transfection. For shArg with Argr, only data analyzed at 72 h after transfection is shown. Arg knockdown neurons showed a reduction of dendrite branch tip numbers as well as total dendrite length at 72 h after transfection. These neurons also exhibit decreased spine density and an increase of filopodia ratio. Expression of shRNA-resistant Arg rescues these phenotypes in knockdown neurons. J, Averaged spine head width of neurons transfected with control vector, shArg, and shArg with Argr. Arg knockdown neurons show enlargement of spine heads compared with control. **p < 0.01, ***p < 0.001 when compared with control vector; #p < 0.05, ##p < 0.01, ###p < 0.001 when compared with shArg. Two-way ANOVA with Bonferroni post-tests; n = 20–37 neurons, four independent cultures. K, Correlation between spine density and spine head width in Arg knockdown neurons. Spine density correlates negatively with spine head width. r = −0.4306, p = 0.0003, n = 66 neurons.
