
Figure 3.
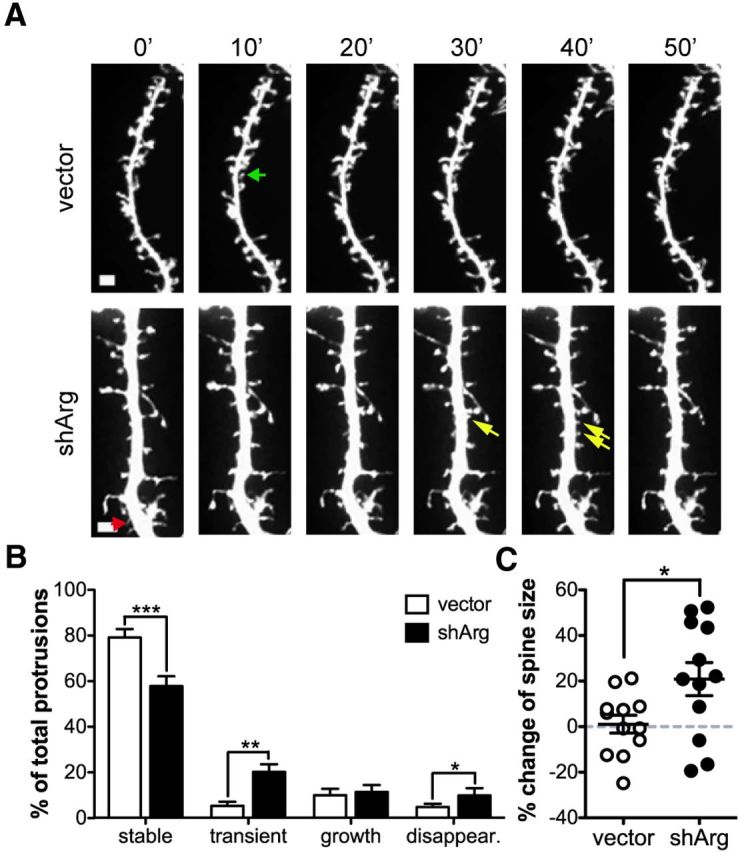
Arg knockdown neurons exhibit more dendritic spine destabilization events. A, Confocal images of control vector or shArg-transfected neurons imaged with 10 min interval for 1 h. Examples of spine behavior are shown as colored arrows. Green, spine growth. The spine appears after the second frame and persists to the last frame. Red, Spine disappearance. The spine appears at the first frame but disappears at the last frame. Yellow, Transient spines. The spines are only evident in middle frames of the time-lapse series. Scale bar, 1 μm. B, Quantification of the stable, transient, growth, and disappearance spines. C, Within all stable spines, the averaged spine size change is shown. *p < 0.05, **p < 0.01, ***p < 0.001, unpaired Student's t test, n = 12 neurons.