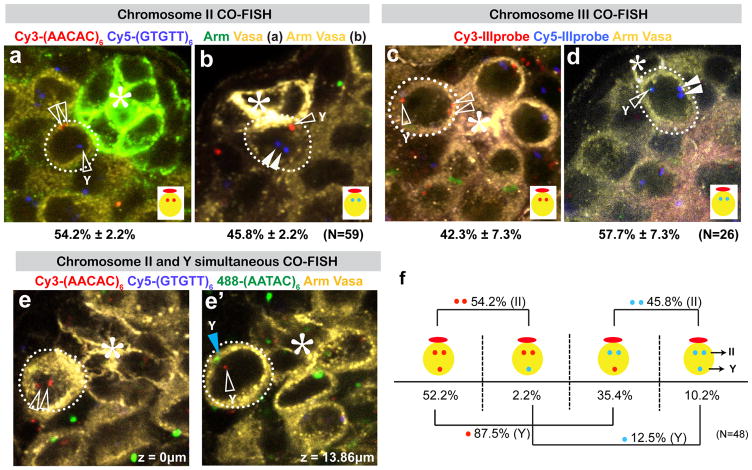
Figure 2. Autosomes are randomly segregated during GSC divisions.
Representative images of CO-FISH results using chromosome II probes (a, b), and chromosome III probes (c, d). Lone signals that correspond to the Y chromosome are marked with “Y”. N, number of GSCs scored. (*) Hub. e) A representative image showing that the lone signal of the (AACAC)6 probe (open arrowheads) is close to the (AATAC)6 signal (blue arrowhead). f) Summary of scoring results using chromosome II probes. Paired signals segregate randomly (Cy3-Cy3:Cy5-Cy5=54.4:45.6), whereas lone signals segregate non-randomly. (Cy3:Cy5=87.6:12.4). (AACAC)6 and (AATAC)6 sequences are on the same strand of the Drosophila Y chromosome.

