Figure 2.
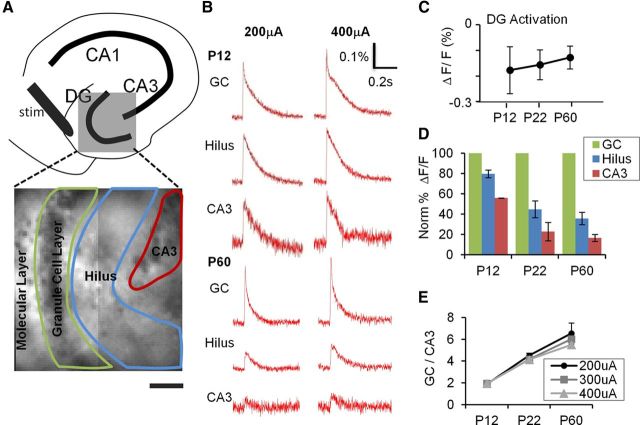
Postnatal development of DG gating behavior. A, Top, A schematic illustration depicting subregions of the hippocampus. Bottom, The DG (gray box) is expanded in a VSD image with an overlay of the ROI delineating subregions used to measure DG responses elicited by PP stimulation. B, VSDI time-resolved fluorescence plots for the subregions depicted in A for P12 (top) and P60 (bottom) animals. PP stimulation elicits comparable depolarizations in the GC, hilus, and CA3 at P12, but little depolarization of hilus and CA3 at P60, despite robust responses in GC. C, DG response amplitude (ΔF/F0) is comparable at all developmental ages (elicited by a 400 μA PP stimulus). D, P12, P22, and P60 mice (n = 8 slices in 3 animals, n = 7 of 2 animals, and n = 6 of 2 animals, respectively), show progressively less propagation of synaptic responses through GC (green) to hilus (blue) and CA3 (red). All data points are normalized to GC layer response at 400 μA, which is equivalent across groups (see C). E, Plots of DG gating function, the ratio of GC to CA3 activation intensity, depict the significant increase in the DG gating property as postnatal development progresses, at several stimulus intensities (200 μA (●), 300 μA (■), and 400 μA (▴). p < 0.001 for the animal age factor affecting gating (two-way ANOVA). p = 0.16 for stimulus intensity affecting gating (two-way ANOVA).

